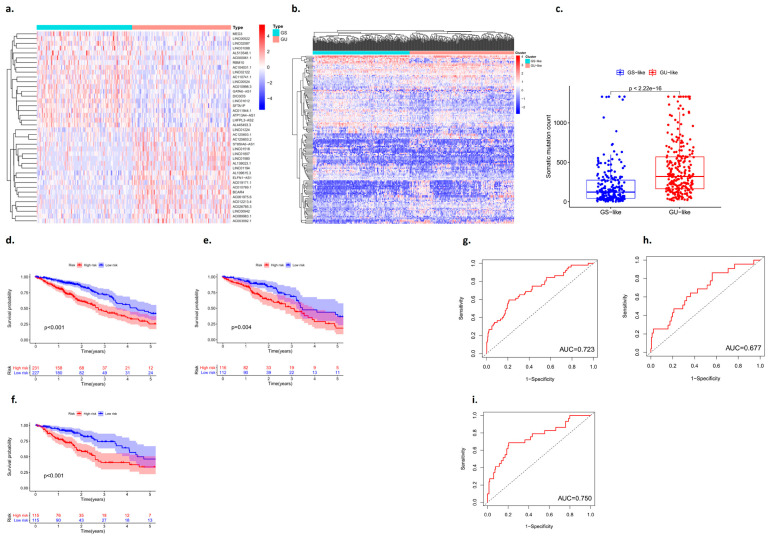
Figure 2.
Identification of genes associated with genomic instability in lung adenocarcinoma. (a,b) Heat map analysis of the number of unstable gene mutations (GS: genomic stability; GU: genomic instability). (c) Somatic mutation count between the GS group and the GU group. (d–f) Kaplan–Meier curves analysis. (g–i) ROC curve analysis.

