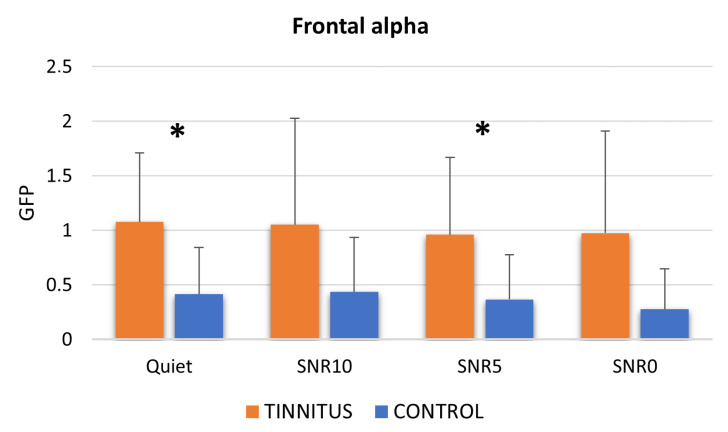
Figure 6.
Graph representing the mean frontal alpha values estimated for each group in each condition and the statistically significant differences resulting from the Mann–Whitney U-test between TIN and CTRL groups (Quiet, SNR10, SNR5, SNR0). * stands for p < 0.05. Error bars stand for standard errors.

