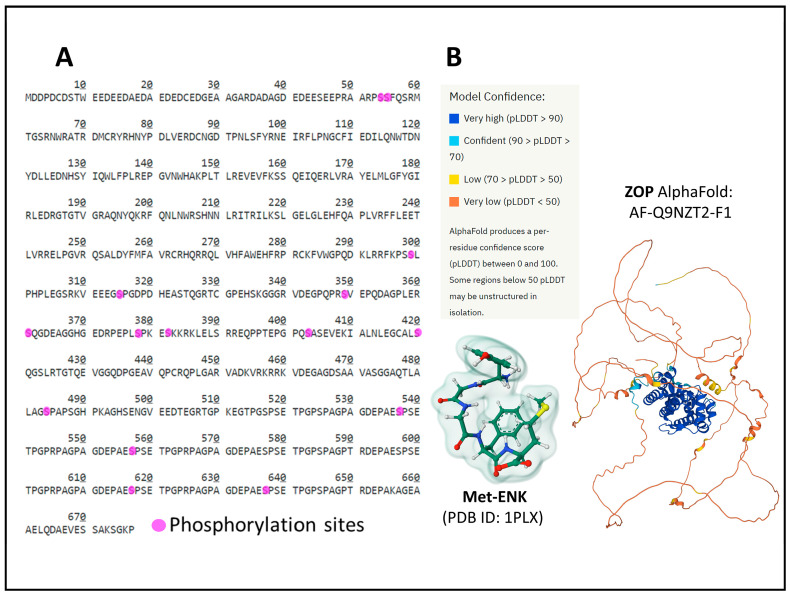
Figure 8.
The primary structure of the ZOP receptor with the indication of posttranslational phosphorylation sites (A) [19]. Panel (B) represents the AlphaFold prediction [87,88] of the human ZOP structure and the structure (Gaussian volume) of its ligand Met-ENK. The figure of Met-ENK is from the Protein Data Bank [51] and corresponds to PDB ID 1PLX [89], drawn with the free web-based open-source toolkit Molstar (https://molstar.org/ (accessed on 17 May 2023) [53]). The AlphaFold representation is from the AlphaFold Protein Structure Database (https://alphafold.ebi.ac.uk/entry/Q9NZT2, accessed on 12 June 2023)).

