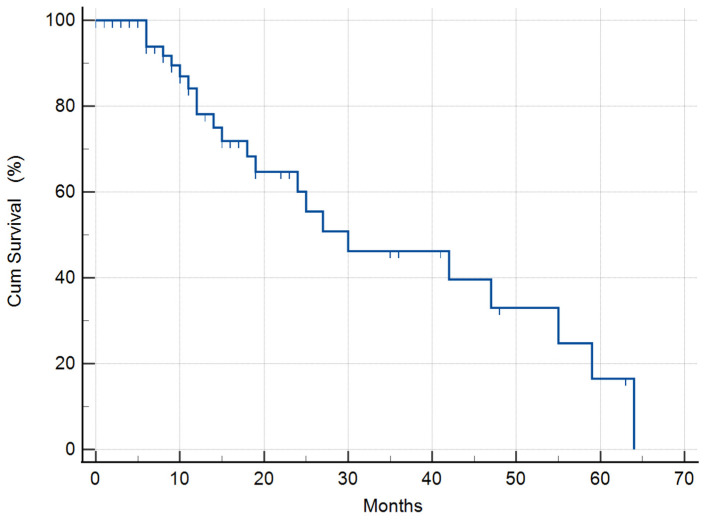
Figure 1.
Kaplan–Meier graphs on the survival of the whole study population of 55 GMB patients (33 males, 22 females), showing a 30 (95% CI: 9.4–50.5) months MST, compared to the 12.1–14.4 months MST based on the historical data of GBM patients. The hash marks on the survival curve indicate when a patient was censored; the patient’s survival time exists.

