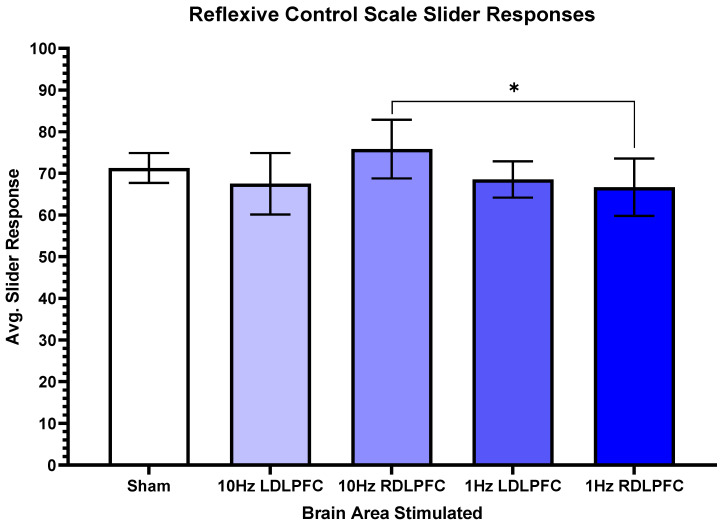
Figure 6.
Reflexive control scale slider responses. This figure shows the relationship between the slider responses when asked about control over the game. There are significant differences in the 10 Hz Right and 1 Hz Right regions, p = 0.04. Standard error is plotted, and no other significant findings were reported. * p < 0.05.

