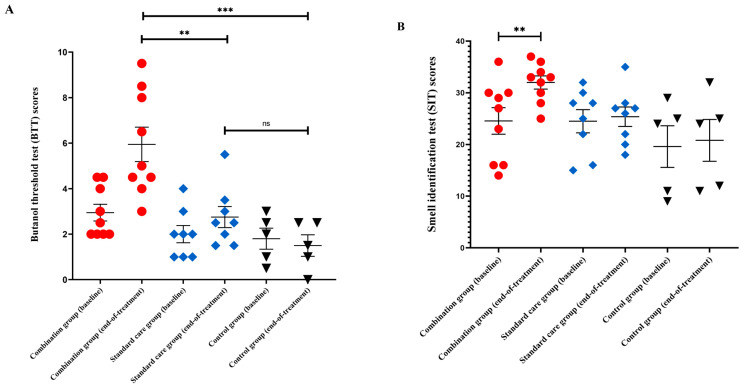
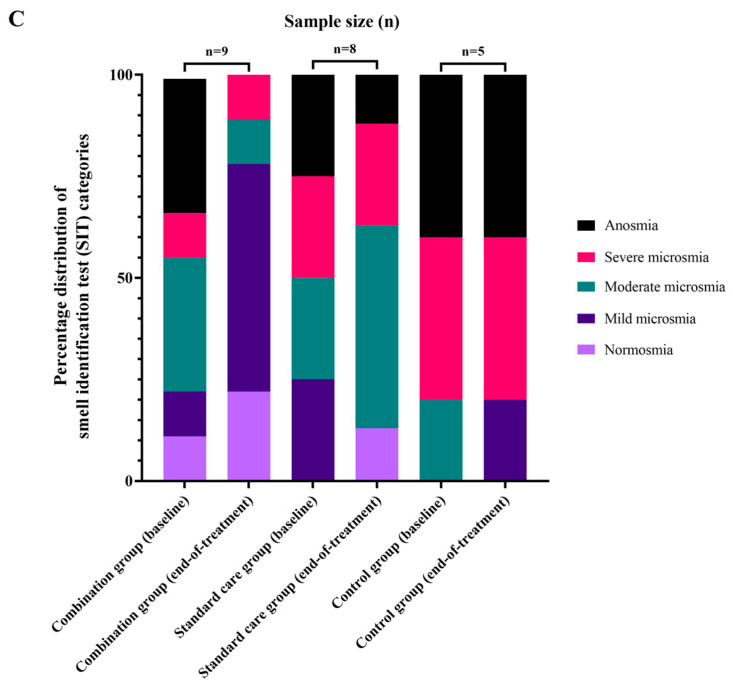
Figure 2.
Functional olfactory assessments. (A) Scattered plot showing the butanol threshold test (BTT) scores; (B) scattered plot showing the smell identification test (SIT) scores; and (C) percentage distributions of SIT categories among trial participants, between baseline and end-of-treatment. Error bars are means, and standard error of the mean (SEM). *** p < 0.001; ** p < 0.010; ns: not significant.


