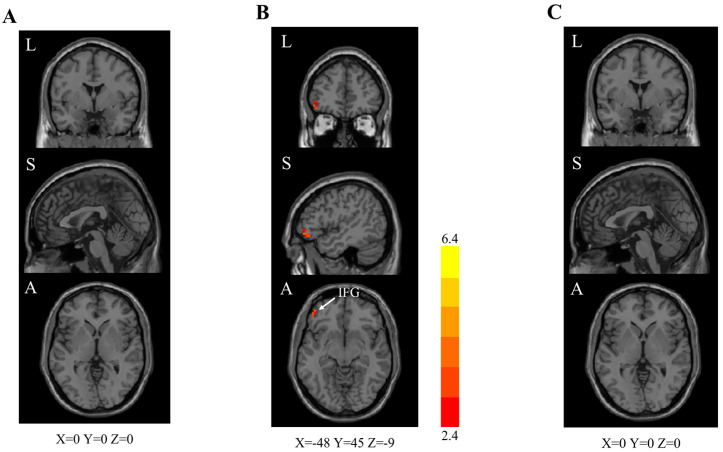
Figure 4.
End-of-treatment (week 4) rs–fMRI brain scan images (left caudate as the seed region). Two-sample t test. GRF correction (voxel-level p < 0.010, cluster-level p < 0.050). rs–fMRI = resting-state functional magnetic resonance imaging. z values are represented by the colour bars. A = anterior. L = left. S = superior. IFG = inferior frontal gyrus. (A) Combination [oral vitamin A in combination with olfactory training (OT)] group versus standard care (OT alone) group. (B) Combination group versus control (clinical observation) group. (C) Standard care group versus control group.

