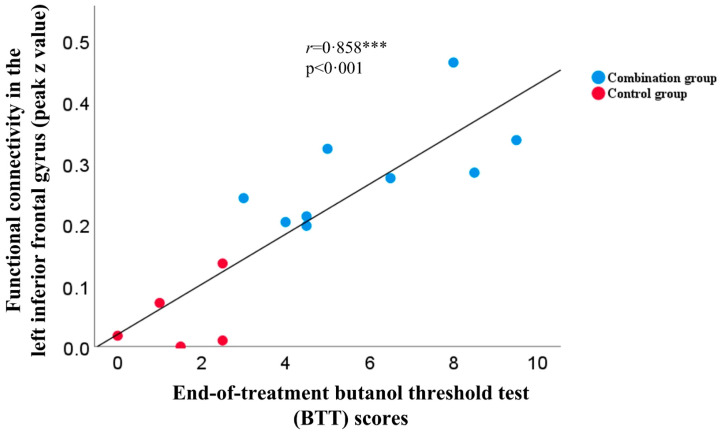
Figure 5.
Correlations between functional connectivity in the left inferior frontal gyrus and end-of-treatment BTT scores. The peak z value represents the maximal functional connectivity in the left inferior frontal gyrus (between left caudate seed and voxels) for the combination and control group at the end-of-treatment [two-sample t test; GRF correction (voxel-level p < 0.010, cluster-level p < 0.050)], which demonstrated positive correlation with the end-of-treatment butanol threshold test (BTT) scores (n = 14, r = 0.858, p < 0.001). *** p < 0.001.

