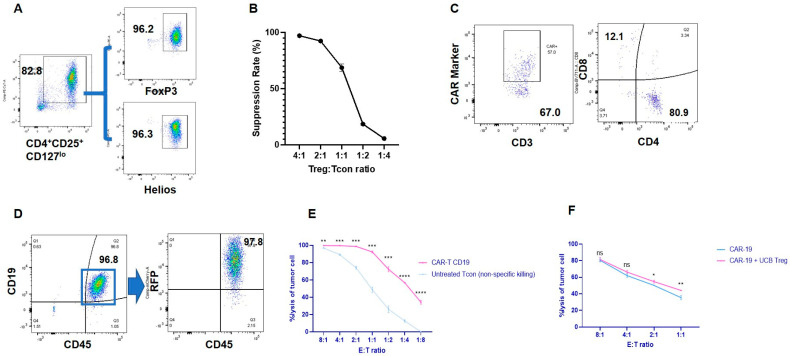
Figure 1.
UCB Tregs do not interfere with CAR T cell−induced cytotoxicity. (A) UCB Treg phenotype. Freshly harvested UCB Tregs were cultured ex vivo with CD3/28 DynabeadsTM and the continued presence of IL−2 for 14 days. At the time of harvest, phenotype analysis of the cells using Flow cytometry was performed for cell surface expression of CD4+CD25+CD127lo and intracellular expression of FOXP3hiHelioshi. (B) Cell Suppression Assay. Ex-vivo cultured UCB Tregs were co-cultured with CTV-labeled Tcon (CD4+CD25−) cells in the presence of CD3/28 beads at different ratios of 4:1, 2:1, 1:1, 1:2, and 1:4 to evaluate their function in Tcon cell proliferation. CTV-labeled Tcons were activated with CD3/CD28 beads at a ratio of 2:1 for CTV-labeled Tcon cells: CD3/CD28 beads and then co-cultured with different ratios of unlabeled UCB-Tregs. Proliferation of CTV-labeled Tcons was assessed by the LSR Fortessa Cell Analyzer after 96 h of culture. Percentage suppression was calculated using the following formula: 100% × (1 − percentage of proliferating CTV-diluting Tcons in the presence of UCB Tregs at a different ratio/percentage of proliferating CTV-diluting Tcons when cultured alone). (C) CAR T cell phenotype. Clinical−grade CD19+ CAR T cells were analyzed for cell surface expression of CD3, 4, 8, and CAR markers. The two flow cytometry plots are in parallel, and both are based on single−cell gating. This is a one-time quality control test of CAR-T cell samples before animal experiments to determine the baseline expression intensity of CAR, CD4, and CD8. The sample does not contain UCB Treg cells. (D) Lymphoma cell phenotype. RFP-labeled CD19+ Raji cells were analyzed using flow cytometry for cell surface expression of CD19, CD45, and RFP. The two FACS plots are both based on single-cell gating. (E) CART induces tumor cytotoxicity. A flow cytometer-based tumor cytotoxicity assay was performed to analyze the CART-induced tumor cell lysis when compared to Tcon alone as a control. CD19 CART cells demonstrated significantly higher toxicity for CD19-expressing RFP−labeled Raji cells when compared to Tcon at different CAR T: Raji cell ratio of 8:1 (99.6% vs. 96.8%); 4:1 (99.5% vs. 89.1%); 2:1 (98.6% vs. 74.1%); 1:1 (92.2% vs. 48.6%); 1:2 (72.2% vs. 26.1%); 1:4 (56.7% vs. 12.5%); and 1:8 (34.1% vs. 0%). (F) UCB Tregs do not interfere with CART-induced tumor cytotoxicity. No impact of the addition of UCB Tregs was observed in the ability of the CD19 CAR T cells to exert cytotoxicity on CD19 Raji cells at different ratios: 8:1 (80.4% vs. 81.5%); 4:1 (62.0% vs. 66.2%); 2:1 (50.1% vs. 54.7%); 1:1 (35.4% vs. 44.1%). (B,E,F) Experiments were performed in triplicate. Error bars represent SEM. Statistical differences compared with PB were quantified by a paired t−test; * p < 0.05, ** p < 0.01, *** p < 0.001, **** p < 0.0001. ns = not significant; CTV = CellTraceTM Violet; PB = peripheral blood; SEM = standard error of means.

