Figure 3.
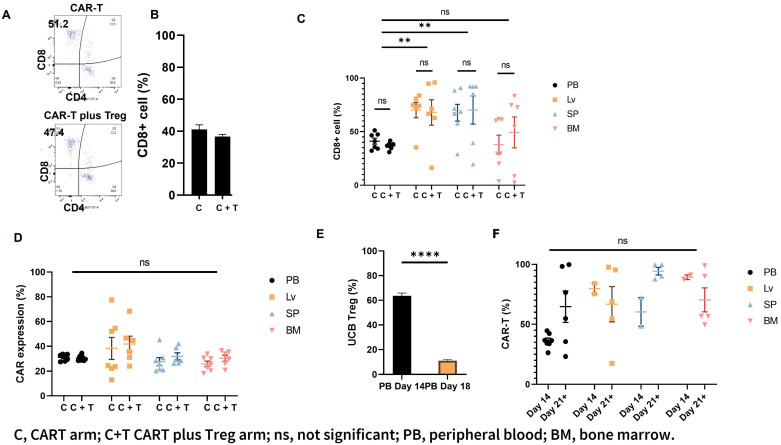
UBC Tregs do not impact CAR T persistence in vivo. (A,B) CD8+ T cells are similar in the PB of CAR T vs. CAR T + UCB Treg recipients. Representative flow cytometric plots of CAR T gating are shown; the circulating CD8+ effector T-cell population in the PB of the recipients of CAR T does not differ from CAR T plus UCB Treg cells. (C) CD8+ T cells are similar in different organs of CAR T vs. CAR T + UCB Treg recipients. No differences were observed in the distribution of the CD8+ effector population in liver, spleen, and BM samples of the CAR T (Arm 3; C) vs. CAR T + UCB Treg cell (Arm 4; C+T) recipients. (D) CAR expression is similar in different organs of CAR T vs. CAR T + UCB Treg recipients. No difference in CAR expression was observed between the recipients of CAR T (Arm 3; C) vs. CAR T plus UCB Treg cells (Arm 4; C+T) in PB, liver, spleen, or BM samples. (E) Circulating UCB Tregs decline over time. The circulating UCB Treg cells remained elevated in the PB circulation until day 14 and dropped to control levels around day 18. Statistical differences compared with PB Day 14 were quantified by the student t-test. (F) CAR T cells show persistence in CAR T + UCB Treg recipients. The circulating UCB Treg cells did not exert any negative impact on the circulating CAR T cells, as demonstrated by their sustained and continued presence in PB on days +14 and +21. (C–F) Error bars represent SEM (n = 7); statistical differences compared with PB were quantified by two-way ANOVA using GraphPad Prism software (version 9.5.0): ** p < 0.01, **** p < 0.0001, ns, not significant. PB, peripheral blood; BM, bone marrow.

