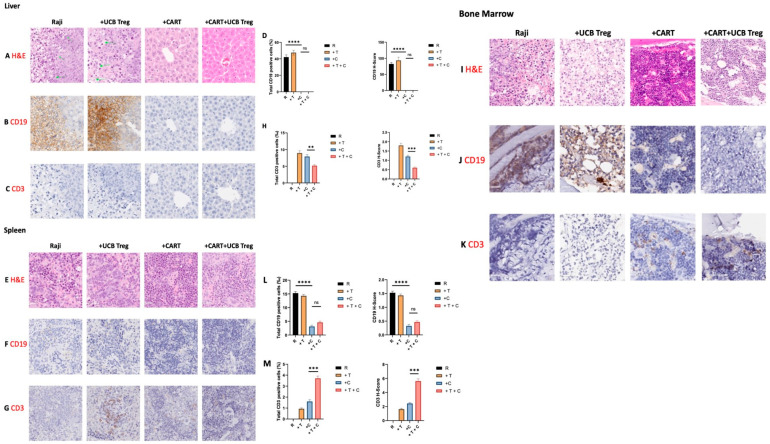
Figure 4.
UCB Tregs do not interfere with CAR T cell-mediated tumor clearance. Histopathologic examinations of liver, spleen, and BM tissue show: (A–C) The liver architecture was disrupted and invaded by the tumor cells in Arm 1: Raji-only arm (row 1; image 1), as well as in Arm 2: Raji + UCB Treg cells (row 1; image 2). Immunohistochemical staining showed the detection of CD19-positive tumor cells in both arms (row 2; images 1 and 2). No evidence of tumor was detected in Arm 3: Raji + CAR T cell recipients or Arm 4: Raji + CAR T + UCB Treg cell recipients with complete preservation of the tissue architecture (rows 1 to 2; images 3 and 4). Specifically, no differences in the CD3+ T cell infiltrate were observed in either arm (row 3; images 1–4). (E–G) Tissue disruption was seen in the spleen of Arm 1: Raji-only mice (row 1; image 1) and Arm 2: Raji + UCB Treg cell recipient (row 1; image 2); however, tumor invasion was not detected by the CD19 IHC stain of the splenic tissue in either arm (row 2; images 1-4). CD3+ T cell staining showed some presence in Arm 2: Raji + UCB Treg only and Arm 3: Raji + CAR T recipients, but barely in Arm 4: Raji + CAR T + UCB Treg cell recipients (row 3; images 1–4). (I–K) Massive tumor infiltration of bone marrow was detected in the Arm 1: Raji only control (row 1; image 1) and Arm 2: Raji + UCB Treg cell recipients (row 1; image 2), whereas no tumor was detected in the Arm 3: Raji + CAR T and Arm 4: Raji + CAR T + UCB Treg cell recipients (row 1; images 3 and 4). A dense lymphocytic infiltration was evident in Arm 3: Raji + CAR T cell recipient (row 1; image 3), whereas the bone marrow architecture was well preserved in Arm 4: Raji + CAR T + UCB Treg cell recipient (row 1; image 4). Immunohistochemical staining showed the detection of CD19-positive tumor cells in Arm 1: Raji-only and Arm 2: Raji + UCB Tregs recipients (row 2; images 1 and 2). No evidence of tumor was detected in Arm 3: Raji + CAR T cell recipients or Arm 4: Raji + CAR T + UCB Treg cell recipients. (D,H,L,M) Quantification analysis of the H-score for human CD19 and CD3 positivity. The H-score was defined by the percentage of strongly positive stain × 3 + moderately positive stain × 2 + weakly positive stain × 1. A final value of 0–300 was also calculated at 40× magnification using the software HALO (v3.5-3577.140). A p < 0.05 was considered statistically significant. ** p < 0.01, *** p < 0.001, **** p < 0.0001. The statistical differences were quantified by a one-way ANOVA or student’s t-test.

