
Table 9.
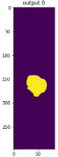
Segmentation output (highlighted in yellow) of the osteosarcoma cancerous cell.
| Sample No. (MRI Slice) |
Input | Ground Truth | Output | ||
|---|---|---|---|---|---|
| T1W | T2W | T1W + Gd | |||
| 1 (80th slice) |

|

|

|

|
|
| 2 (80th slice) |

|

|

|

|

|
| 3 (80th slice) |

|

|

|

|

|