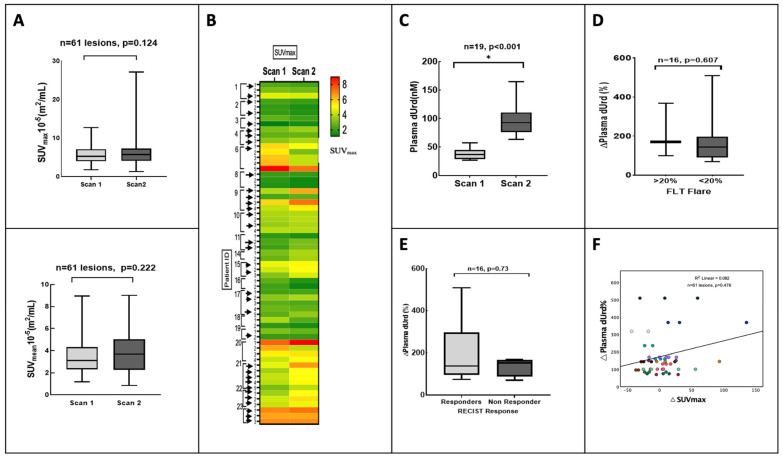
Figure 2.
Response heterogeneity detected by 18F-FLT uptake and plasma deoxyuridine (dUrd). (A) The difference in SUVmean and SUVmax between the two scans for all lesions represented as a box plot. (B) Visual depiction of the heterogeneity in 18F-FLT uptake between the first and second scan in the individual lesions in each patient as seen on a heatmap (lesions with 18F-FLT flare shown with black arrow). (C) Box plot of the changes in plasma dUrd between the two scans. (D) The difference in plasma dUrd among the group with 18F-FLT flare above 20% threshold and group with no flare is seen on the box plot (Note * significant p value). (E) The difference in plasma dUrd among the responders and non-responders based on RECIST 1.1 on imaging depicted by box plot. (F) The correlation graph between dUrd change and 18F-FLT ∆SUVmax for all tumour lesions (as depicted by different colours for each patient with multiple lesions). The Spearman correlation coefficient is R2 = 0.082, p = 0.476.

