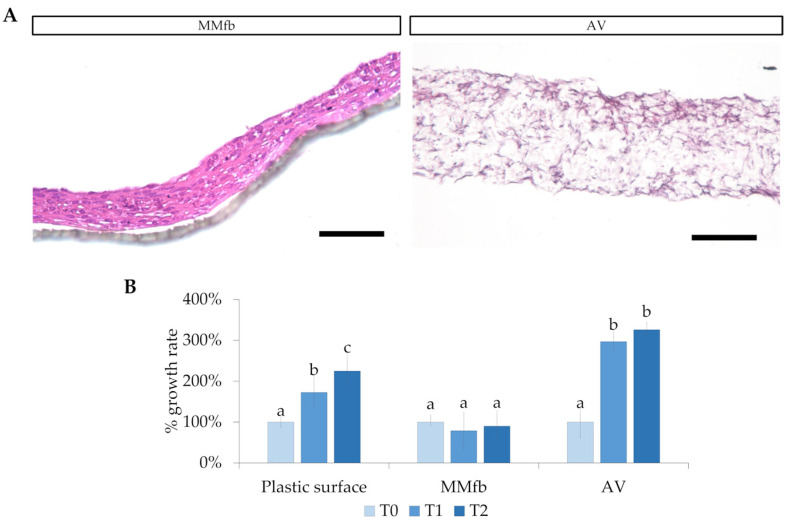
Figure 2.
(A) Fibroblast colonization and infiltration in the Matrigel matrix (MM) and inside the Alvetex™ (AV) scaffold (HE staining; scale bar 250 µm). (B) Relative RTpiMI epithelial cell growth rate, expressed as a count of nuclei. Given the difference among the systems, different timing was selected: for plastic surface and MMfb, T0, T1, and T2 correspond to immediately, 48 h, and 72 h after seeding, respectively; for AV scaffolding, T0, T1, and T2 represent 14, 21, and 28 days, respectively. In all cases, images were acquired at 40× magnification. Different letters within the graph indicate statistically significant differences (p < 0.05).

