Figure 2.
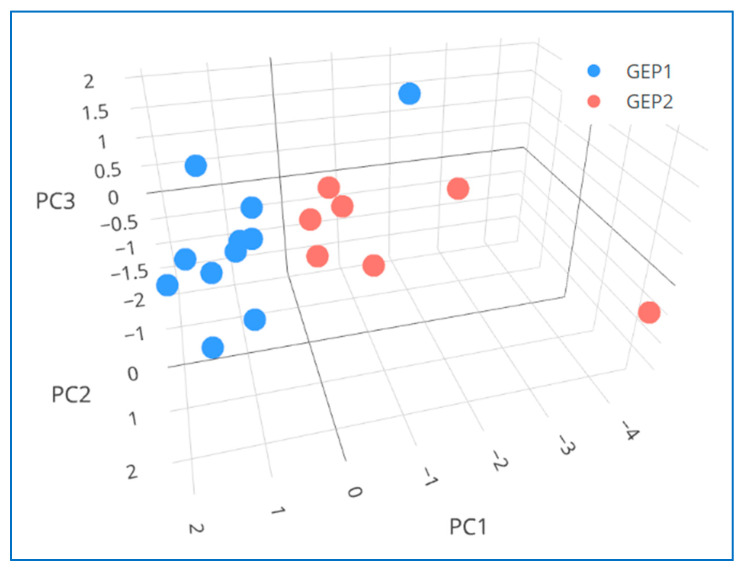
Three-dimensional plot illustrating the principal component analysis (PCA) results for six vitreous cytokines differentially expressed in eyes with choroidal melanomas (CMs) of different prognostic classes. CM group included 18 patients, of which 11 were classified as having Class 1—low risk (GEP1) and 7 as having Class 2—high risk (GEP2) tumors based on the primary tumor biopsy-based gene expression profiling (GEP) test used for metastatic risk prediction (DecisionDx-UM®) [28]. Vitreous cytokine levels are based on the MFI (median fluorescence intensity) values that were extracted/used for relative quantification of the cytokine abundance (see Methods) and are displayed here on a logarithmic scale. In PCA, the first three PCs were found to cumulatively explain 77% of data variance (PC1: 51%, PC2: 15%, and PC3: 11%), and the clustering of eighteen vitreous samples based on the expression profiles of six prognostically relevant cytokines (MCP-3/CCL7, PDGF-AB/BB, TNF-β, G-CSF, IL-13, and IL-3) has indicated a potential separation between different CM prognostic classes: all but one (10 of 11) GEP1 samples clustered together and separately from the GEP2 samples.

