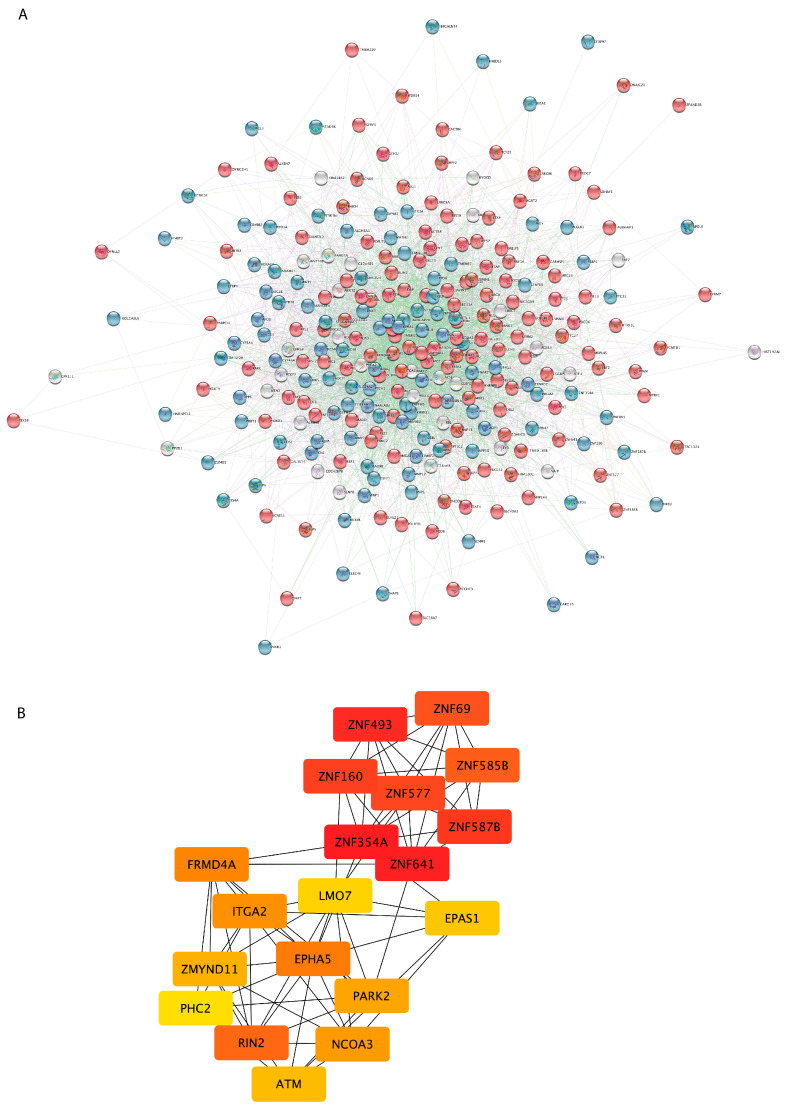
Figure 3.
PPI network construction and hub gene screening of DEGs in sALS fibroblasts. (A) PPI network was constructed using the STRING Online Database and visualized by Cytoscape. Each node represents one gene/protein (n = 277), and the interaction between two nodes is defined as the edge (n = 3378). Node color is associated with the fold change: genes down-regulated in sALS fibroblasts vs. CTRL are colored in blue, while red nodes correspond to genes up-regulated in sALS fibroblasts vs. CTRL. (B) The network of the 20 hub genes is shown with red (high ranking) and yellow (low ranking) nodes, based on the ranking score in the cytoHubba plugin.

