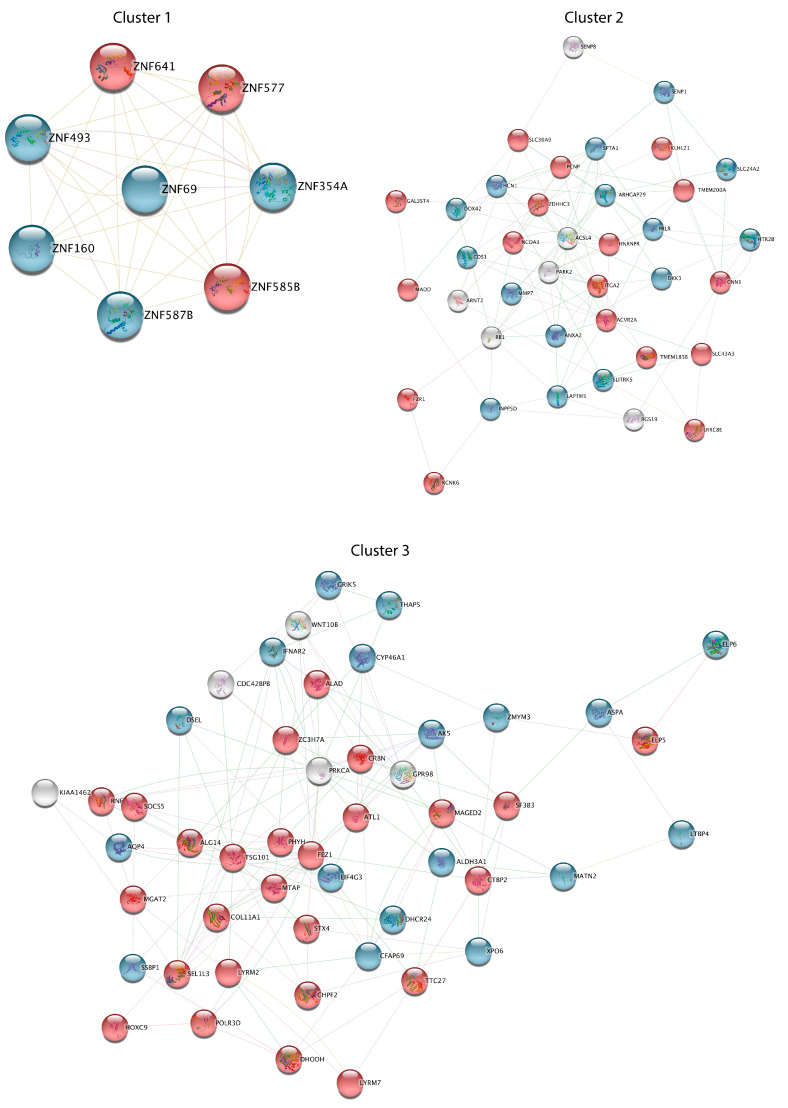
Figure 4.
Functional analysis of three DEG clusters in sALS fibroblasts. Three significant interacting and functional clusters from the general PPI network were obtained by the MCODE plugin. Node color is associated with the fold change: genes down-regulated in sALS fibroblasts vs. CTRL are colored in blue, while red nodes correspond to genes up-regulated in sALS fibroblasts vs. CTRL.

