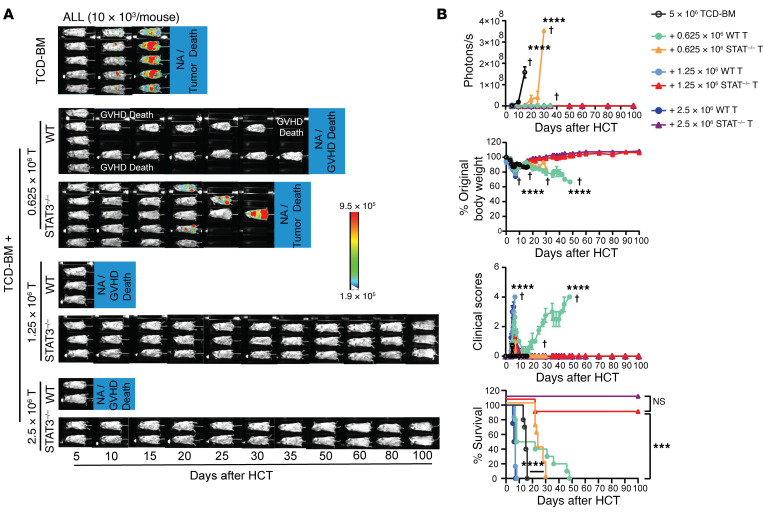
Figure 3. Comparison of GVL activity of WT and STAT3–/– donor T cells.
Lethally irradiated WT BALB/c recipients were i.v. inoculated with ALL/Luc cells (10 × 103 per mouse) and engrafted with TCD-BM cells (5 × 10⁶) from WT C57BL/6 donors with or without CD90.2+ T cells (0.625, 1.25 or 2.5 × 10⁶) from WT or STAT3–/– C57BL/6 donors on day 0. (A) Recipients were monitored for tumor growth by using in vivo BLI after HCT. Representative BLI images of each mouse from each time point are shown. (B) Curves of photon/second, percentages of original body weight, clinical GVHD score, and percentage survival are shown. Data are represented as mean ± SEM. n = 10 (TCD-BM); n = 10 (+0.625 × 10⁶ T); n = 6 (+1.25 × 10⁶ T); n = 4 (+2.5 × 10⁶ T) combined from 2 replicated experiments. Crosses indicate deaths. P values were calculated using nonlinear regression (curve fit) for photon/second comparisons (B) and log-rank test for survival comparisons (B). ***P < 0.001; ****P < 0.0001.

