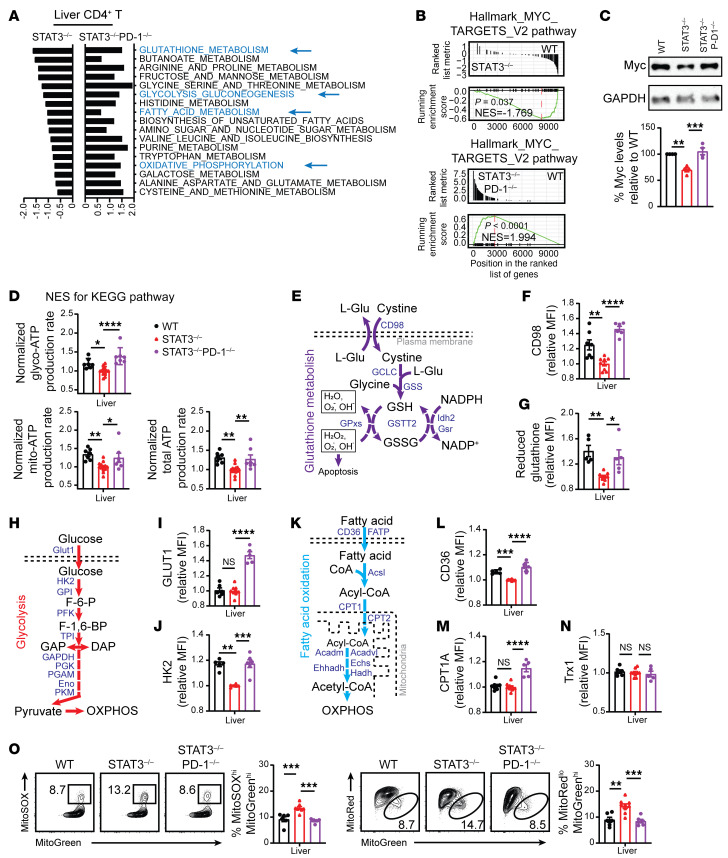
Figure 6. Stat3 deficiency in donor T cells augments PD-1–mediated inhibition of GSH/Myc pathways and production of Mito-ROS.
Lethally irradiated BALB/c recipients were engrafted with TCD-BM and CD90.2+ T cells from WT, STAT3–/–, or STAT3–/–PD-1–/– C57BL/6 donors as described for Figure 5. On day 6 after HCT, CD90.2+ T cells from liver were isolated for RNA-Seq, Seahorse, immunoblotting, and flow-cytometry analysis. Data are combined from at least 2 replicate experiments. (A) NES of KEGG pathway activity of CD4+ T cells, setting the activity of WT CD4+ T cells as the reference, for comparisons with STAT3–/– and STAT3–/–PD-1–/– T cells. (B) GSEA plots of MYC target V2 pathway-related gene set expression in WT, STAT3–/–, and STAT3–/–PD-1–/– donor CD4+ T cells. (C) Myc protein was measured by immunoblotting. (D) Glyco-ATP, Mito-ATP, and total ATP. n = 7–14. (E) The GSH metabolism pathway is shown. (F and G) MFI of CD98 and reduced GSH of CD4+ T cells in the liver. n = 5–9. (H) Glycolysis pathway is shown. (I and J) MFI of GLUT1 and HK2 of CD4+ T cells. n = 5–9. (K) FAO pathway is shown. (L and M) MFI of CD36 and CPT1A of CD4+ T cells. n = 5–9. (N) MFI of Trx1 of CD4+ T cells. n = 5–9. (O) Representative flow cytometry pattern and mean ± SEM of percentage MitoSOXhiMitoGreenhi and percentage MitoRedloMitoGreenhi CD4+ T cells. n = 5–9. Separate experiments were performed with WT versus STAT3–/– or STAT3–/– versus STAT3–/–PD-1–/– in D, F, G, I, J, L, M, N, and results were normalized to the mean values for STAT-3–deficient cells. Data are represented as mean ± SEM. P values were calculated by using 1-way ANOVA (C, D, F, G, I, J, L, and O). NS, P ≥ 0.05; *P < 0.05; **P < 0.01; ***P < 0.001; ****P < 0.0001.

