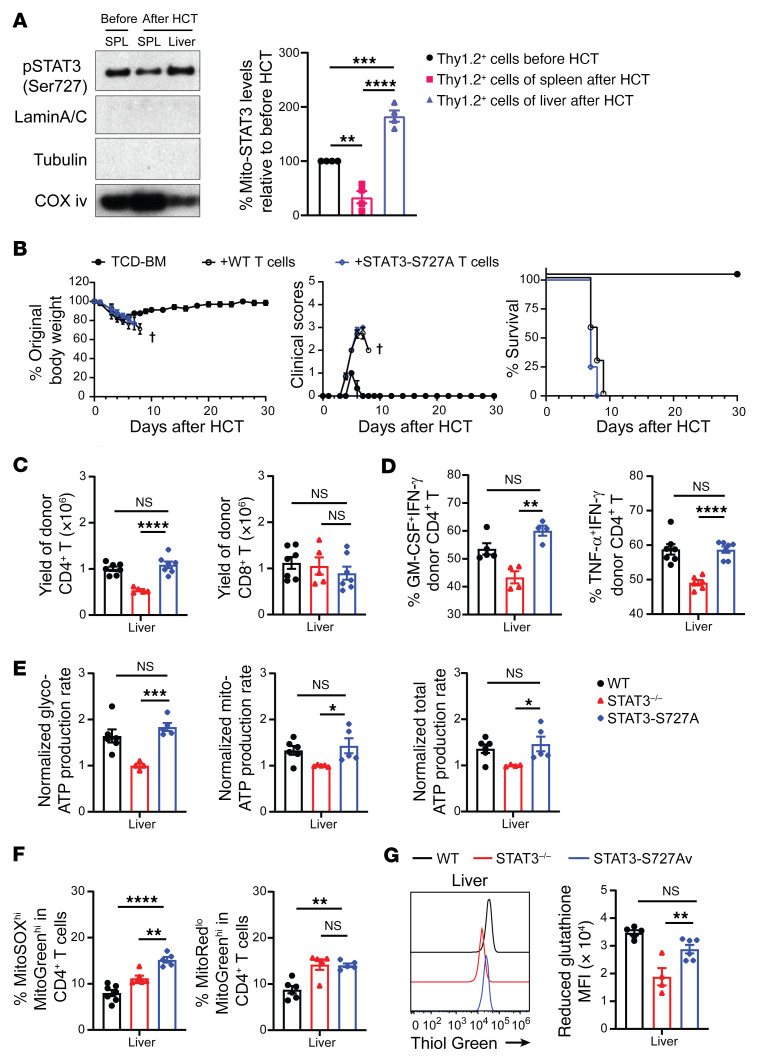
Figure 9. Mito-STAT3 deficiency alone does not reduce GSH synthesis or prevent acute GVHD.
(A) Lethally irradiated BALB/c recipients were engrafted with TCD-BM (5 × 10⁶) and CD90.2+ T (1 × 10⁶) from WT C57BL/6 donors. Mitochondria of CD90.2+ T cells were isolated from donor spleen before HCT and from recipient spleen (SPL) and liver 6 days after HCT. Mitochondrial STAT3 levels were measured by immunoblotting. LaminA/C, tubulin, and COX iv were used as loading controls for nuclear, cytosol, and mitochondria, respectively. (B–G) Lethally irradiated BALB/c recipients were engrafted with TCD-BM (5 × 10⁶) from WT C57BL/6 donors and CD90.2+ T cells (1 × 10⁶) from WT or STAT3–/– or STAT3-S727A C57BL/6 donors. On day 6 after HCT, lymphocytes from liver were isolated. (B) Plots of percentage original body weight, clinical GVHD score, and percentage survival. n = 3 (TCD-BM); n = 7 (TCD-BM+WT T); n = 8 (TCD-BM+STAT3-S727A T), combined from 2 replicated experiments. (C) Yields of donor CD4+ and CD8+ T cells. n = 5–7 combined from 2 replicates. (D) Percentages of TNF-α+IFN-γ+ and GM-CSF+IFN- γ+ Th1 cells. n = 4–7 combined from 2–3 replicates. (E) Experiments were performed as WT versus STAT3–/– and STAT3–/– versus STAT3-S727A. Relative Glyco-ATP, Mito-ATP, and total ATP production rates are shown, using the mean of STAT3–/– T cells as the reference in each experiment. n = 4–6 combined from 2 replicates. (F) Percentages of MitoSOXhiMitoGreenhi CD4+ T cells and MitoRedloMitoGreenhi CD4+ T cells from different groups are compared. (G) Representative flow cytometry pattern of reduced GSH and means ± SEM of MFI. n = 4–6 combined from 2 replicates. Data are represented as mean ± SEM. P values were calculated by 1-way ANOVA (A and C–G). NS, P ≥ 0.05; *P < 0.05; **P < 0.01; ***P < 0.001; ****P < 0.0001.

