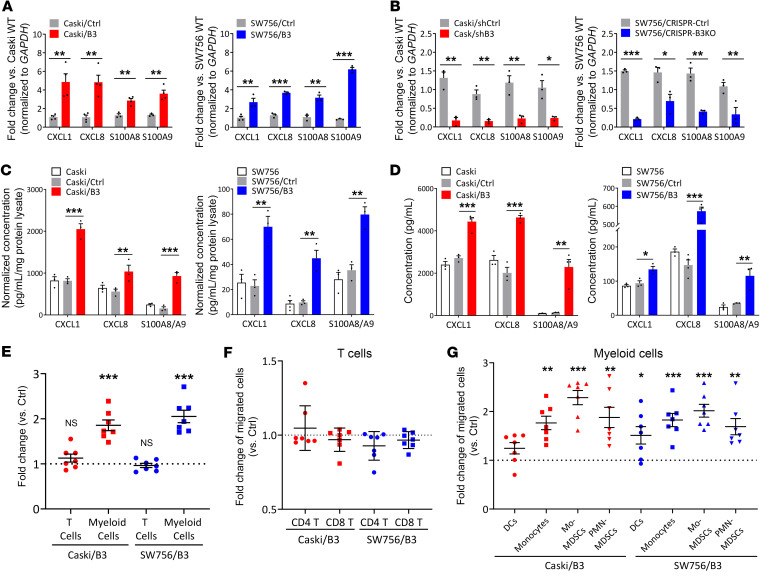
Figure 2. SERPINB3 results in upregulation of CXCL1/8 and S100A8/A9 chemoattractants, promoting myeloid cell migration from patient-derived peripheral blood.
(A) Cells were transduced with pUltra vector (Caski/Ctrl, SW756/Ctrl) or pUltra-SERPINB3 (Caski/B3, SW756/B3), and CXCL1/8 and S100A8/A9 expression was examined by qPCR. (B) Caski cells were transfected with scrambled negative control shRNA (Caski/shCtrl) or shRNAs specifically against SERPINB3 (Caski/shB3); SW756 cells were transduced with a CRISPR control vector (SW756/CRISPR-Ctrl) or CRISPR/Cas9 for SERPINB3 KD (SW756/CRISPR-B3KO). CXCL1/8 and S100A8/A9 expression was examined by qPCR. Gene expression was normalized to GAPDH, and fold changes were calculated by comparing with expression levels in parental cells (Caski WT or SW756 WT). (C) Intracellular chemokine protein expression was measured by ELISA, and expression levels were normalized to the total protein concentration. (D) Supernatant was collected from adherent cells in the monolayer, and chemokine secretion was measured by ELISA. Data are presented as the mean ± SEM of 3 independent experiments. *P < 0.05, **P < 0.01, and ***P < 0.001, by Mann-Whitney U test (A and B) and 1-way ANOVA with Tukey’s post hoc test (C and D). (E–G) PBMC migration toward supernatant collected from cancer cells was examined by Transwell assays, and the migrated PBMC populations were analyzed by flow cytometry (Supplemental Figure 3A). Fold changes were calculated as the percentage of migrated (E) T cells and myeloid cells, (F) T cell subsets, and (G) myeloid cell subsets in Caski/B3 or SW756/B3 supernatant relative to Caski/Ctrl or SW756/Ctrl supernatant. Data are shown as the mean ± SEM. *P < 0.05, **P < 0.01, and ***P < 0.001, by 2-tailed, 1-sample t test against 1. Each dot represents the mean of duplicate values for a single donor sample (n = 7).

