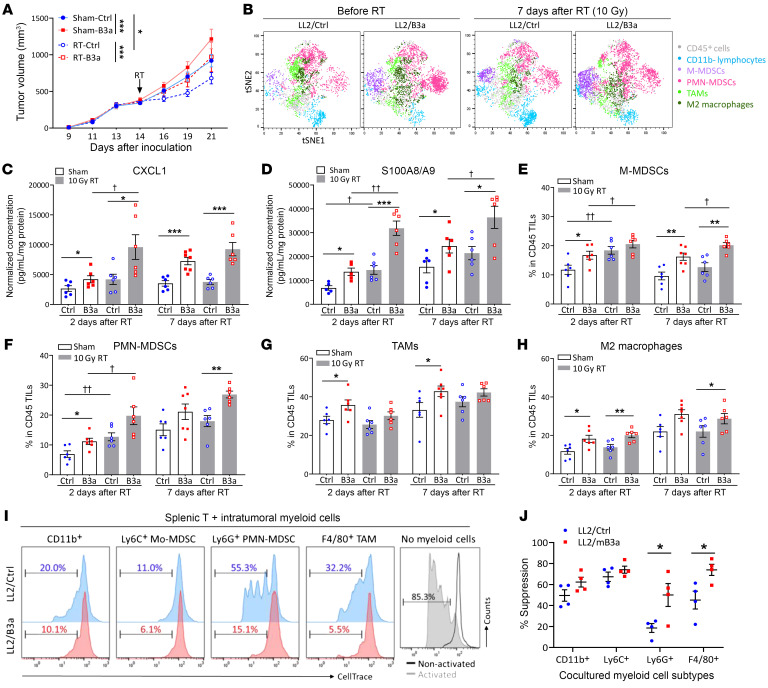
Figure 3. SERPINB3 tumors are enriched for suppressive myeloid cells, and this suppression is further augmented by RT.
(A) Tumor growth of C57/BL6 mice with LL2/Ctrl tumors (blue lines) and LL2/B3a tumors (red lines) randomized to receive sham treatment (solid lines) or 10 Gy RT on day 14 (dotted lines). *P < 0.05 and ***P < 0.001, by 2-way ANOVA. (B) viSNE plots show flow cytometric analysis of total viable CD45+ immune cells from tumors with separate clustering by predefined cell-surface markers, including M-MDSCs (CD11b+Ly6G–Ly6Chi), PMN-MDSCs (CD11b+Ly6G+), TAMs (CD11b+Ly6G–F4/80+), M2 macrophages (CD11b+Ly6G–F4/80+CD163+), and lymphocytes (CD45+CD11b–). (C and D) The chemokines CXCL1 and S100A8/A9 in tumor homogenates were examined by ELISA. Data were normalized to the protein concentration for each tumor homogenate. (E–H) Cumulative data from FACS analysis show alteration of immune cell infiltration by SERPINB3 expression and radiation in LL2 tumors. The graphs represent the frequencies of (E) CD11b+Ly6G–Ly6Chi M-MDSCs, (F) CD11b+Ly6G+ PMN-MDSCs, (G) CD11b+Ly6G-F4/80+ TAMs, (H) CD11b+Ly6G-F4/80+CD163+ M2 macrophages in total TILs. Data in C–H are shown as the mean ± SEM, and each dot represents a biologically independent animal; asterisks indicate comparisons between LL2/Ctrl and LL2/B3a; cross symbols indicate comparisons between sham-treated and RT. *,†P < 0.05, **,††P < 0.01, and ***P < 0.001, by 1-way ANOVA with Tukey’s post hoc test. (I and J) Myeloid cell subtypes were isolated from tumors and cocultured with CellTrace-labeled splenic T cells at a ratio of 1:1 for 4 days. Anti-CD3/anti-CD28 antibodies were added to stimulate T cell proliferation. Histograms show the percentage of divided cells. The percentages of suppression were calculated by comparing with the dilution of CellTrace in splenic T cells without myeloid cell coculturing. Data in I and J are shown as the mean ± SEM. *P < 0.05, by Mann-Whitney U test.

