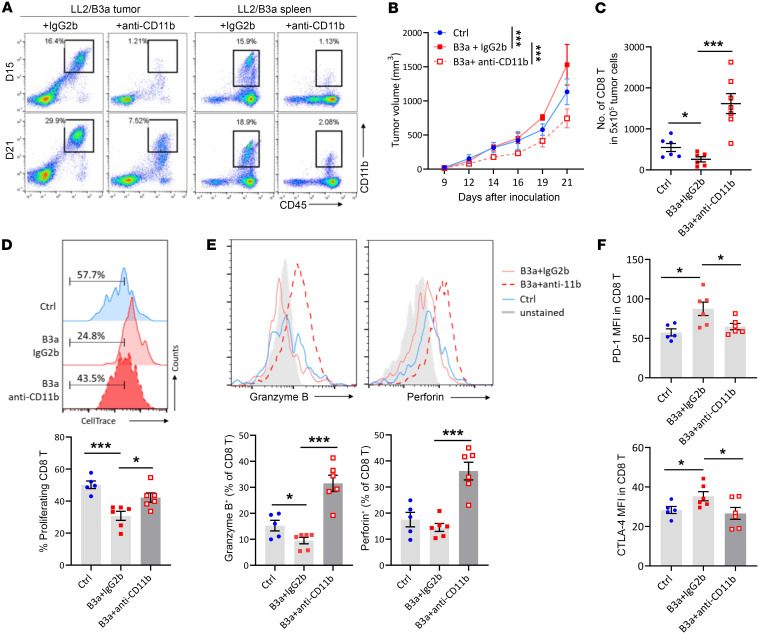
Figure 5. Depleting CD11b+ myeloid cells in SERPINB3 tumors improves T cell activity.
(A) Representative plots show the depletion of CD11b+ cells, gated on CD45+CD11b+ cells, in tumors and spleens on day 15 and day 21 after tumor inoculation. (B) Tumor growth of LL2/Ctrl tumors (blue line) and LL2/B3a tumors treated with anti-CD11b antibody (red dotted line) or anti-IgG2b antibody (red solid line). ***P < 0.001, by 2-way ANOVA. (C) The numbers of infiltrating CD8+ T cells in 5 × 10⁵ total tumor cells were determined by flow cytometry. (D) CellTrace-labeled intratumoral T cells were stimulated with anti-CD3/anti-CD28 antibody for 4 days, and cell proliferation was determined by the dilution of CellTrace. (E) Representative histograms of intracellular cytokine staining of granzyme B and perforin in CD8+ T cells. (F) PD-1 and CTLA-4 expression was examined by flow cytometry and is shown as MFI. Data in C–F are shown as the mean ± SEM, and each dot represents a biologically independent sample. *P < 0.05 and ***P < 0.001, by 1-way ANOVA with Tukey’s post hoc test.

