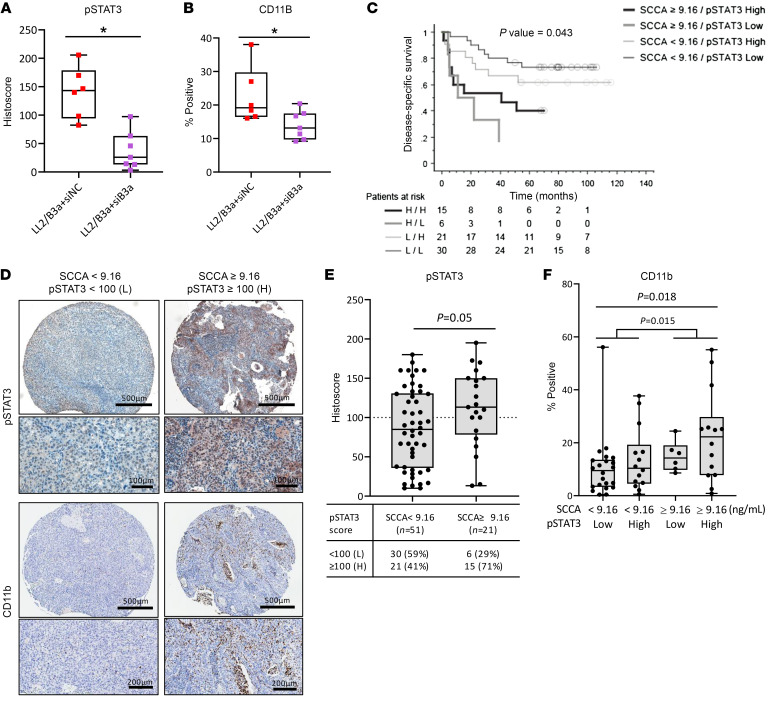
Figure 8. Elevated serum SCCA levels and high tumor p-STAT3 are associated with CD11b expression and poor cancer-specific survival after CRT.
(A and B) Quantification of immunostaining for p-STAT3 and CD11b expression in mouse tumors treated with siNC or siB3. Box plots show p-STAT3 staining scores and the percentage of CD11b+ staining from 8–12 representative fields each for 6–7 mice per group. Box plot whiskers span the minimum and maximum values; lines represent the median. (C) Kaplan-Meier plot shows overall survival for patients with serum SCCA levels below 9.16 ng/mL and a p-STAT3 histoscore below 100 (n = 30) or of 100 or higher (n = 21), compared with patients with serum SCCA levels of 9.16 ng/mL or higher with a p-STAT3 histoscore below 100 (n = 6) or of 100 or higher (n = 15). The average pretreatment serum SCCA value of 9.16 ng/mL from 72 patients with cancer was used as a cutoff. L, low; H, high. (D) Representative images of p-STAT3 and CD11b staining for patients with SCCA levels below 9.16 ng/mL or of 9.16 ng/mL or higher. Scale bars: 100 μm, 200 μm, and 500 μm. (E) p-STAT3 staining score (histoscore) for patients with serum SCCA levels below 9.16 ng/mL versus those with SCCA levels of 9.16 ng/mL or higher. (F) Percentage of the myeloid cell marker CD11b staining in patients with serum SCCA levels below 9.16 ng/mL or of 9.16 ng/mL or higher and a p-STAT3 histoscore below 100 (low) or of 100 or higher (high). Each dot represents an individual patient. Data are shown as the mean ± SEM. A Mann-Whitney U test was used to determine statistical significance.

