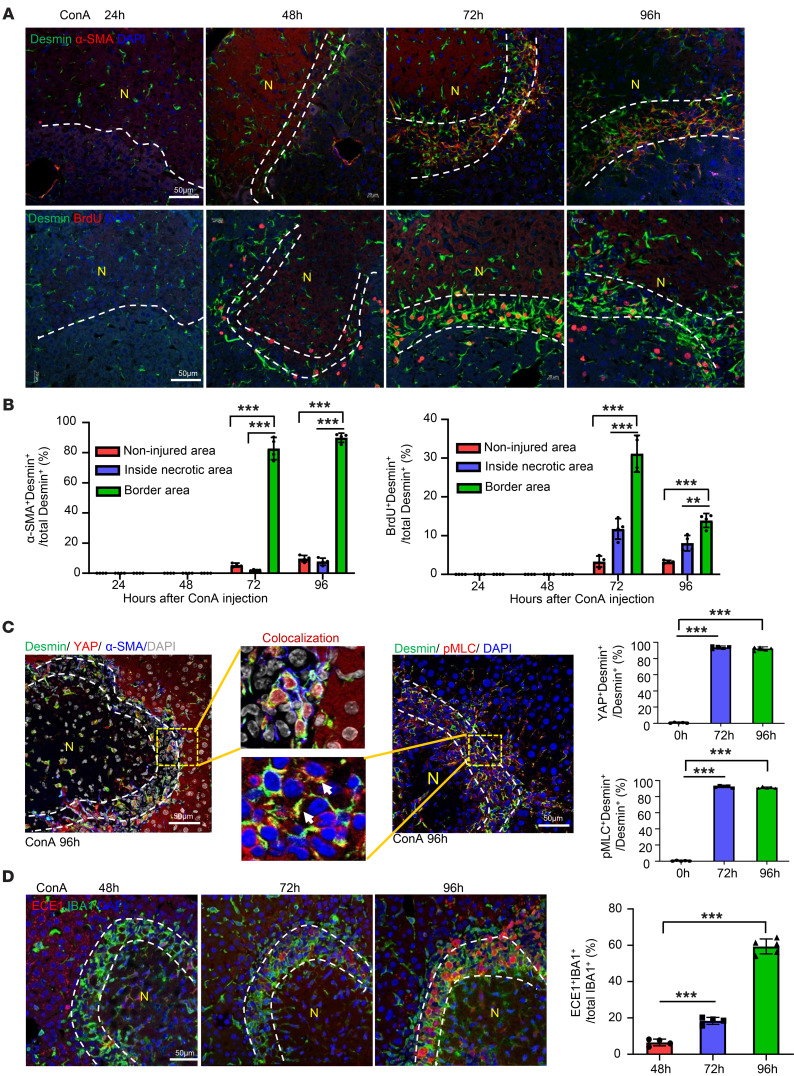
Figure 4. aHSCs aggregate in the border areas of necrosis at the late-stage recovery of live injury.
(A and B) C57BL/6 mice were treated with ConA. BrdU was given 2 hours before sacrifice. Liver tissues were collected and stained with desmin/α-SMA and desmin/BrdU. Representative images are shown in A (n = 4). Quantification of aHSCs and proliferating HSCs in noninjured area, inside necrotic area, and border area in A is shown in B. (C) Liver tissues from ConA-treated mice were stained with desmin/YAP/α-SMA or desmin/PMLC. Representative triple- or double-staining images are shown (n = 5). Quantitation of the percentages of YAP+Desmin+ and pMLC+Desmin+ in border areas was performed. (D) Liver tissues from ConA-treated mice were stained with IBA1/ECE1 (n = 4–5). Dashed lines indicate the border areas of necrotic regions. Quantitation of ECE1+IBA1+/total IBA1+ cells in border areas was performed. Values in B–D are represented as means ± SD. Statistical significance was assessed using 1-way ANOVA followed by Tukey’s post hoc test for multiple groups (B–D). **P < 0.01; ***P < 0.001.

