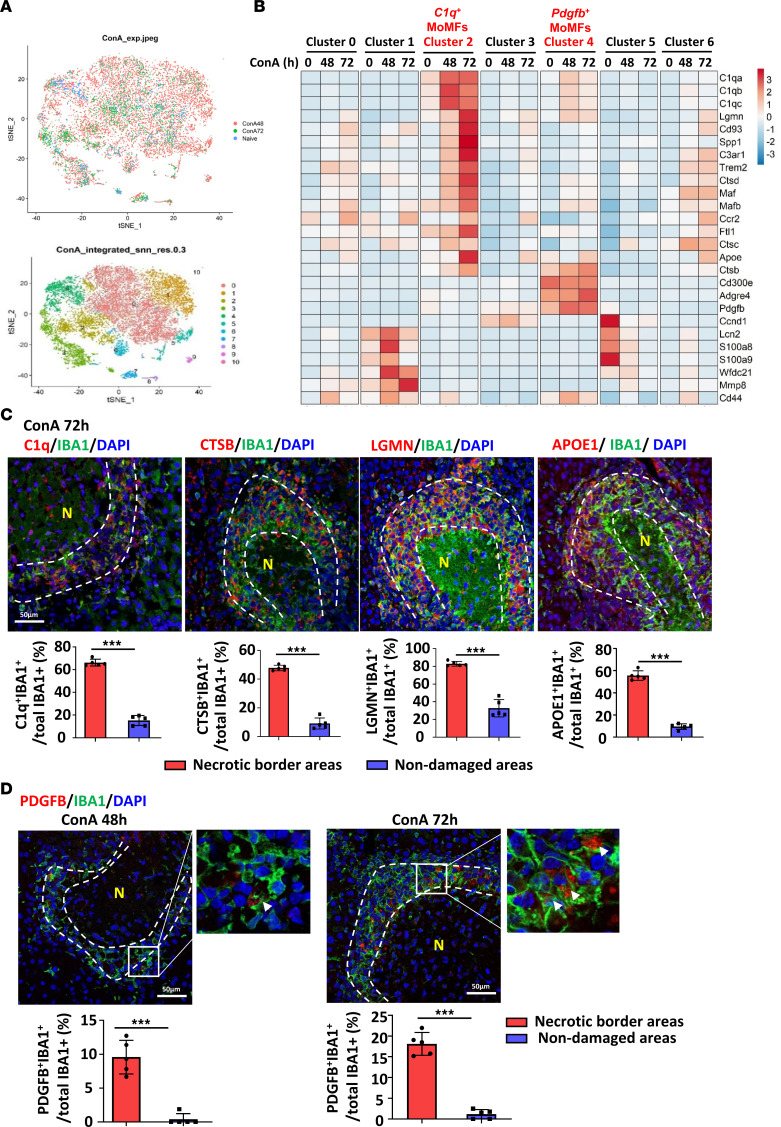
Figure 6. scRNA-Seq identifies 2 clusters of necrosis-associated MoMFs: C1q+ and Pdgfb+ MoMFs.
(A and B) Liver MoMFs were isolated from ConA-treated mice (0-, 48-, and 72-hour time points). These cells were subjected to the 10x Genomics Chromium platform for scRNA-Seq. t-SNE plots of cells from naive (1,106 cells), ConA 48 hours after injection (ConA48) (8,541 cells), and ConA 72 hours after injection (3,575 cells) are shown in A. Heatmap of the signature genes of C1q+ macrophages (cluster 2) and Pdgfb+ macrophages (cluster 4) is shown in B. (C and D) C57BL/6 mice were treated with ConA for 48 or 72 hours. Liver tissues were doubly stained with C1Q/IBA1, CTSB/IBA1, LGMN/IBA1, and APOE/IBA1 (C, n = 5), and PDGFB/IBA1 (D, n = 5). Dashed lines indicate the border areas of necrotic regions. Arrowheads indicate IBA+ cells with PDGFB expression. Representative images and quantitation are shown. Values in C and D are represented as means ± SD. Statistical significance was assessed using 2-tailed Student’s t test for comparing 2 groups (C and D). ***P < 0.001.

