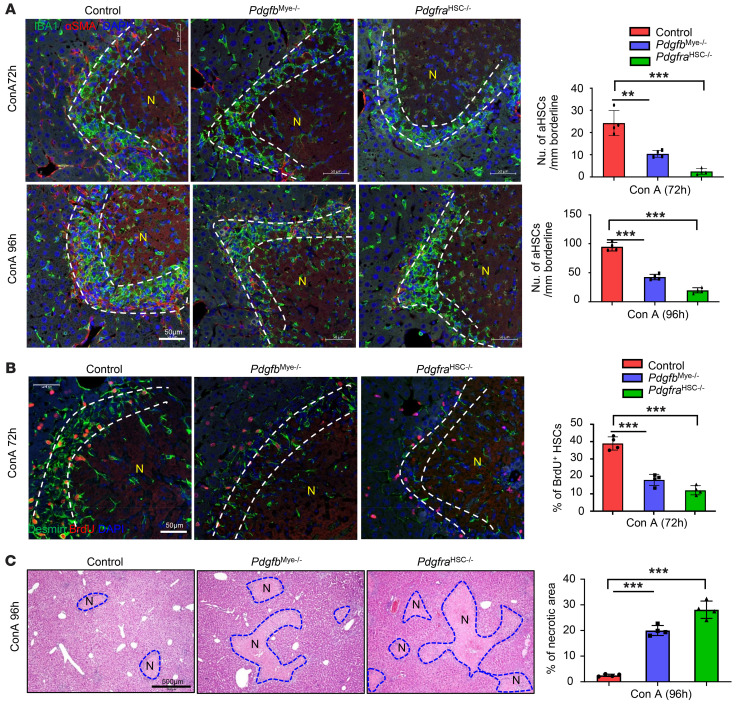
Figure 8. Myeloid cell–derived PDGFB promotes HSC proliferation and activation.
WT, Pdgfbmye–/–, and PdgfraHSC–/– mice were treated with ConA for 72 or 96 hours. BrdU was given 2 hours before sacrifice. Liver tissues were stained with (A) IBA1 and α-SMA (n = 4), (B) BrdU and desmin (n = 4), and (C) H&E (n = 4). Numbers of aHSCs and BrdU+ HSCs in the border of necrotic areas were quantified and are shown on the right. Dashed lines indicate the border areas of necrotic regions. Values in A–C are represented as means ± SD. Statistical significance was assessed using 1-way ANOVA followed by Tukey’s post hoc test for multiple groups (A–C). **P < 0.01; ***P < 0.001.

