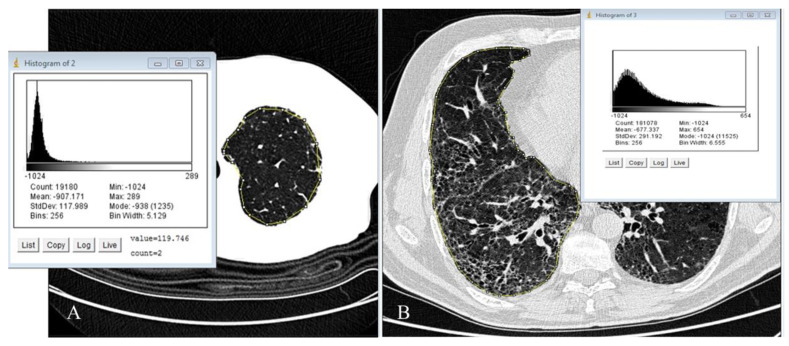
Figure 1.
(A,B) (image J, Java open source): In (A), a control normal lung is depicted by a sharply shifted Gaussian curve with a narrow and tall peak. In (B), a representative slice of the right lung from a patient with advanced idiopathic pulmonary fibrosis, obtained through thin-section volumetric CT, is shown and illustrates the density histogram of the fibrotic lung, which exhibits a less pronounced peak and skewness compared to panel A. The segmented area of interest is highlighted in yellow. On the right side, the results of the digital processing analysis for this specific slice are presented. Once the sampling of the entire lung was completed, the software automatically generated averaged data from the analysis of all slices of both lungs.

