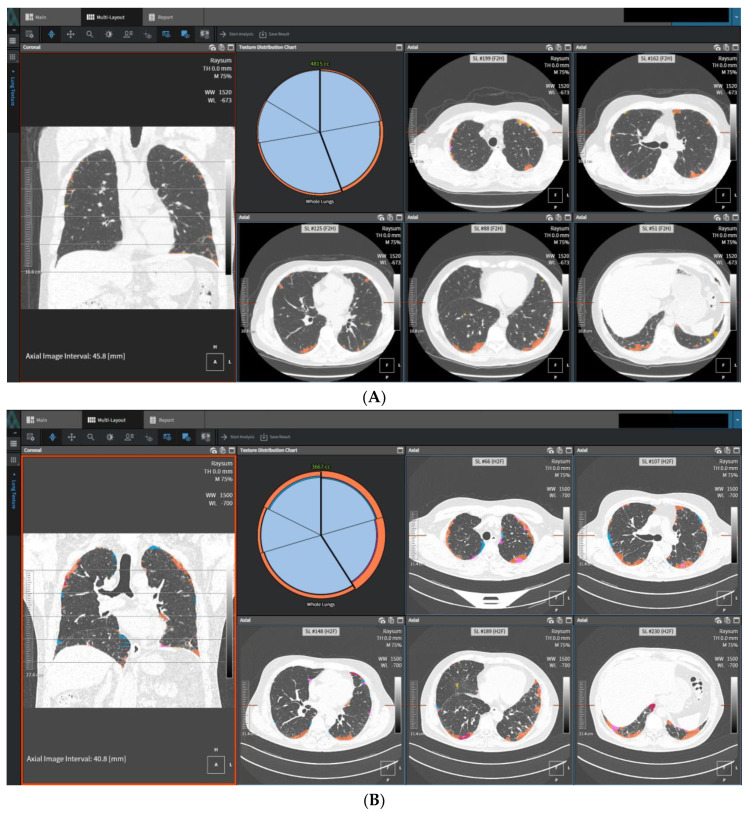
Figure 3.
High-resolution computed tomography (HRCT) images and regions classified as fibrosis by data-driven texture analysis of a 53-year-old man former smoker: (A) the baseline of fibrosis score was 11.2%; baseline FVC % pred was 73%, DLCO % pred was 69.0%. (B) HRCT images in the same subject at a nominal 78-week follow-up. Regions classified as fibrosis by DTA are shown in orange. The DTA fibrosis score increased by 12.6% percentage points at follow-up. FVC declined 10.5% (relative to baseline), DLCO declined 13.0% (relative to baseline).

