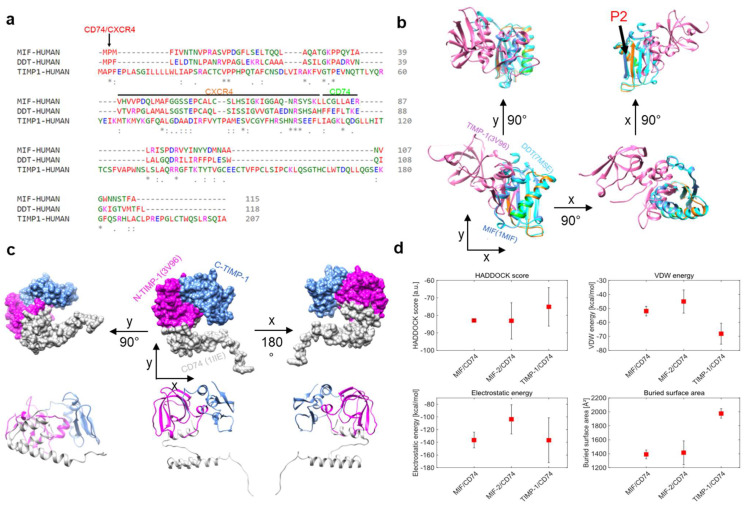
Figure 1.
In silico analysis of TIMP-1–CD74 interaction and comparison of binding parameters between TIMP-1–CD74, MIF–CD74, and MIF-2–CD74 complexes. (a) Comparison/alignment of amino acid sequences of MIF (1MIF), MIF-2 (7MSE), and TIMP-1 (3V96). Potential sequence regions critical for receptor binding are marked by a line/arrow and color (CD74: green; CXCR4: orange; CD74/CXCR4: red). (b) Overlay of MIF, MIF-2, and TIMP-1 structures from different perspectives. The position of the conserved proline-2 is indicated (P2). (c) In silico protein–protein docking of TIMP-1 with a monomer of CD74 (1IlE, grey). The domains of TIMP-1 are color-coded (N-terminal domain, magenta; C-terminal domain, blue). Top panel, surface representation; bottom panel, ribbon representation. (d) Comparison of different docking parameters for the MIF–CD74, MIF-2–CD74, and TIMP-1–CD74 interactions. The average values were calculated using the 4 best structures of each cluster, and the error bars indicate the standard deviation of these values. * Conserved sequence (identical), : Conservative mutation, · Semi-conservative mutation.

