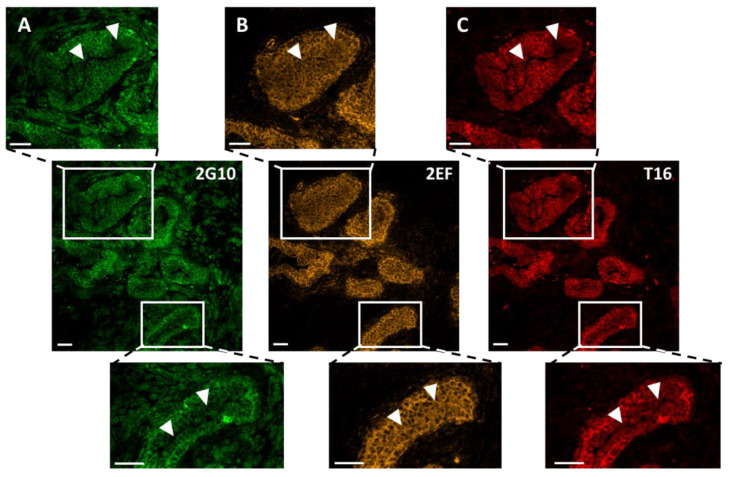
Figure 2.
Comparative binding of 2EF, 2G10 and AbT16 to representative samples of Trop-2-expressing prostate cancer by IF confocal microscopy. (A) 2G10-Alexa488; (B) 2EF-Alexa546; (C) AbT16-Alexa633. The three anti-Trop-2 mAb were utilized simultaneously. Individual signals for each fluorophore were acquired independently, in a sequential manner across fluorescence channels. Magnified regions of interest are indicated by white rectangles. White arrowheads indicate the tumor regions with higher differential penetration/binding capacity of 2EF-Alexa488. Scale bars, 50 µm.

