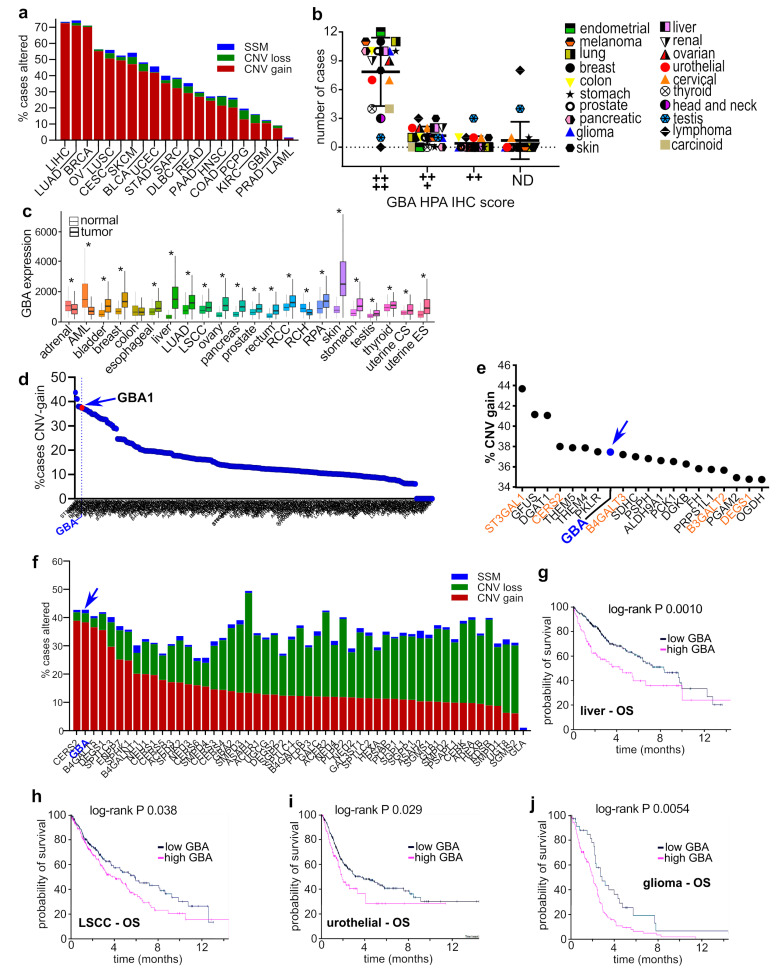
Figure 1.
GBA copy number amplifications and increased expression are highly prevalent in human cancers, and are associated with poor outcomes. (a) TCGA data were queried for genomic alterations in GBA (ENSG00000177628) and plotted as the percentage of cases altered in the database by CNV gain alterations (red segments), CNV loss alterations (green segments), and simple somatic mutations (SSM, blue segments). (b) GBA staining profiles of cancers in the Human Protein Atlas. Plot shows the number of cases with high, medium, low, or nondetectable staining of GBA. (c) GBA expression was examined using the TNMplot database. The Mann–Whitney U test determined significant differences between normal and tumor tissue, marked with an asterisk (*). (d) Pan-cancer TCGA data were analyzed for CNV gain alterations in genes of sphingolipid, lacto, neolacto, ganglio, isoglobo, and globo glycosphingolipids, fatty acid synthesis, elongation, and degradation, citrate and pentose phosphate cycles, pyruvate, glycolysis and gluconeogenesis, fructose, mannose, galactose, glycine, serine, threonine, and glycerolipid metabolic pathways. (e) Top 20 genes with CNV gain alterations in (d). (f) TCGA pan-cancer data were examined for genomic alterations in core sphingolipid metabolism genes (Kegg; hsa00600) and plotted as the percentage of subjects with the indicated genetic lesions within the cohort. (g–j) Kaplan–Meier plots generated with the Human Protein Atlas online tool for GBA and the indicated cancers and outcome measures.

