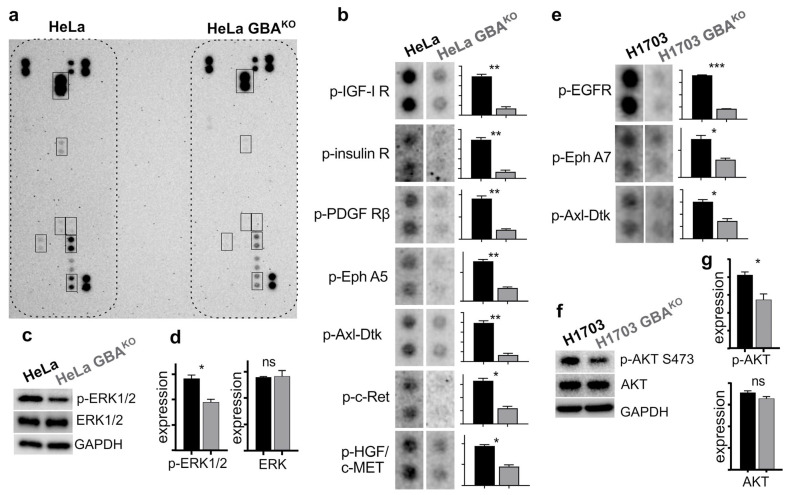
Figure 7.
GBAKO cells have significantly decreased activation of RTKs. (a) Representative image of a Proteome Profiler Human RTK array. For assays, cells were serum-starved for 3 h and then incubated with medium containing 10% FBS for 30 min. Arrays were developed and imaged simultaneously as shown. Spots outlined are shown in (b). (b) Spots for the indicated RTKs in (a) were quantified. (c,d) Cell extracts prepared for experiments in (a) were analyzed by immunoblotting (c) with the indicated antibodies and quantified by densitometry (d). Extracts were run in triplicate. t-Tests were performed with Prism. (e–g) H1703 and H1703 GBAKO cells were treated as cells in (a), and then incubated with Profiler arrays, before quantifying selected spots (e). Extracts were analyzed by immunoblotting (f) and quantified by densitometry (g). Extracts were run in triplicate. All t-tests were performed with Prism 8, and dots were quantified by densitometry using ImageJ 1.53. ns, not significant; * p ≤ 0.05; ** p ≤ 0.01; *** p ≤ 0.0005.

