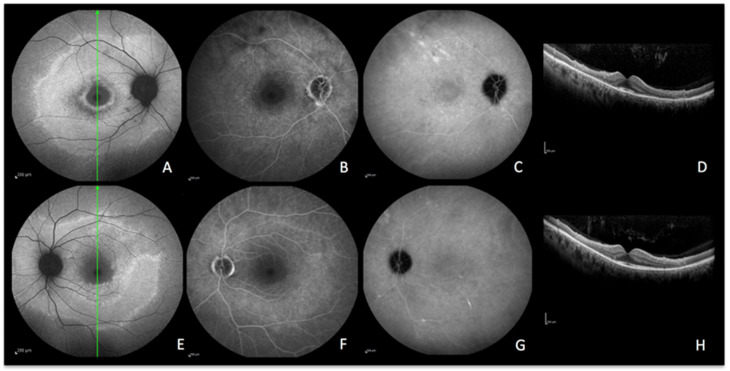
Figure 8.
CAR imaging during active disease. (A–D) right eye. (E–H) left eye. A and E, blue-light autofluorescence showing hyperautofluorescence OD and OS. (B,F) late-phase fluorescein angiography showing faint hyperfluorescence due to loss of photopigment. (C,G) late-phase indocyanine green angiography showing absence of hypofluorescence meaning intact choriocapillaris OD and OS. (D,H) optical coherence tomography showing loss of photoreceptors OD and OS with preservation of the macular area.

