Figure 2.
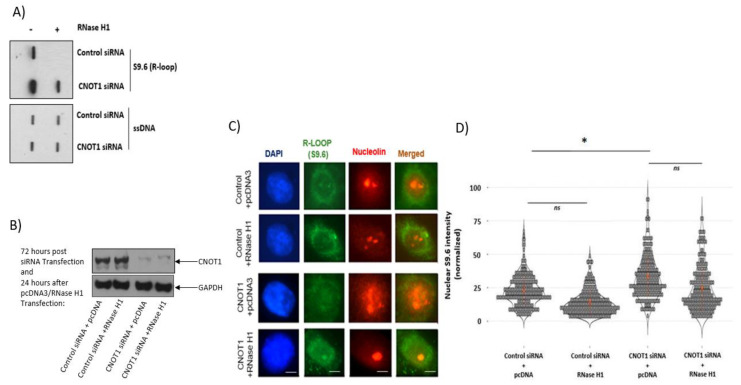
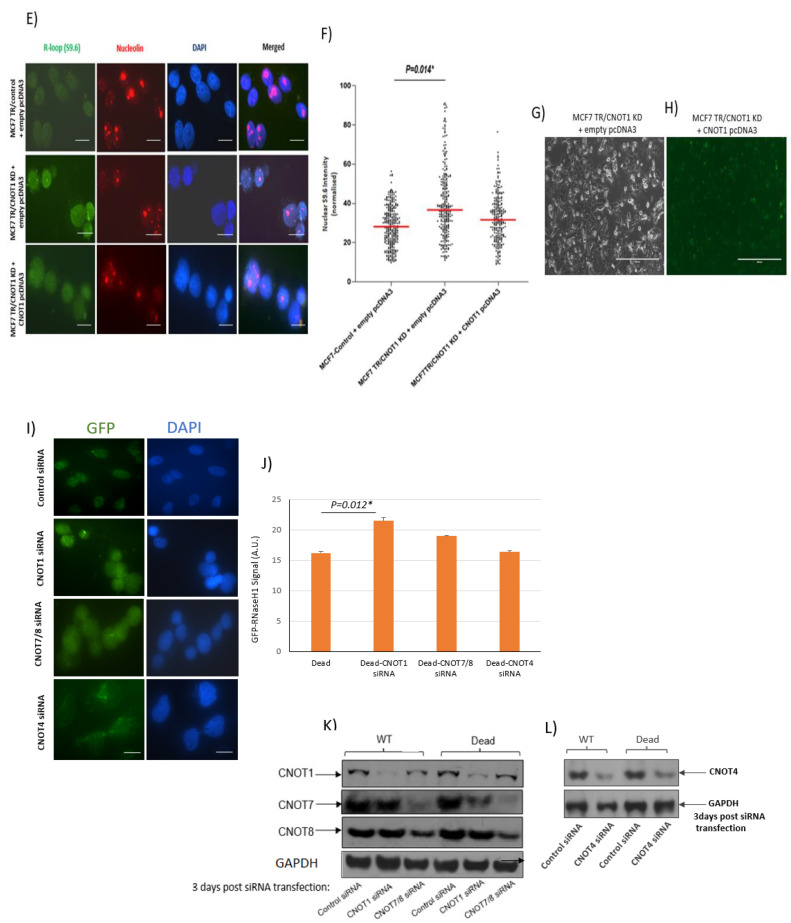
Depletion of CNOT1 leads to increased R-loop formation. (A) Detection of RNA–DNA hybrids using slot blot analysis and S9.6 antibody on gDNA isolated from HeLa cells 72 h post CNOT1 depletion. A ssDNA antibody was used as a loading control (lower panel). (B) Representative Western blot confirms the efficiency of CNOT1 depletion up to 96 h. (C) Co-immunostaining of HeLa cells with S9.6 (green) and nucleolin (red) antibodies 72 h post siRNA transfection and 24 h after recombinant RNase H1 transfection. The nuclear DNA was stained with DAPI. (D) Quantification of S9.6 antibody signal per nucleus after subtraction of nucleolar staining using Image J. Statistical analysis was performed using RStudio statistical software. (n = 3 independent experiments, 100 cells counted per experiment. Stats: Mann–Whitney Wilcoxon Rank Sum). (E) Co-immunostaining of MCF-7 TRCNOT1KD cells with S9.6 (green) and nucleolin (red) antibodies 72 h post +/− 2 μg/mL DOX treatment. (F) Quantification of S9.6 antibody signal per nucleus after subtraction of nucleolar staining using Image J. Statistical analysis was performed using GraphPad Prism statistical software 9.5.1; (n = 3 independent experiments; >100 cells analysed per repeat; Stats: unpaired t-test, * p < 0.05,). (G,H) Representative images show percentage transfection efficiency (21%). Images were collected using an EVOS fluorescence inverted digital microscope. MCF7 Cells were fixed, permeabilized, and labelled with anti-FLAG antibody (green). Percentage transfection efficiency: (fluorescent cells/total number of cells) × 100. Bar 400 µm. (I,J) Representative IF images and bar graph showing the GFP signal obtained from control siRNA, CNOT1 siRNA, CNOT4 siRNA and double CNOT7/8 knock down and in dead-RNH1 U2OS cells. The intensity of GFP signal was equalized across different samples using Image J. Statistical analysis was performed using excel; (n = 3 independent experiments; >100 cells analysed per repeat; Stats: unpaired t-test, * p < 0.05,). Scale bar = 50 µm. AU, arbitrary units. (K,L) Representative Western blot showing the expression of CNOT 1, 7/8 and CNOT4 subunits 3 days post siRNA transfection in In GFP dRNH1 U2OS cells.


