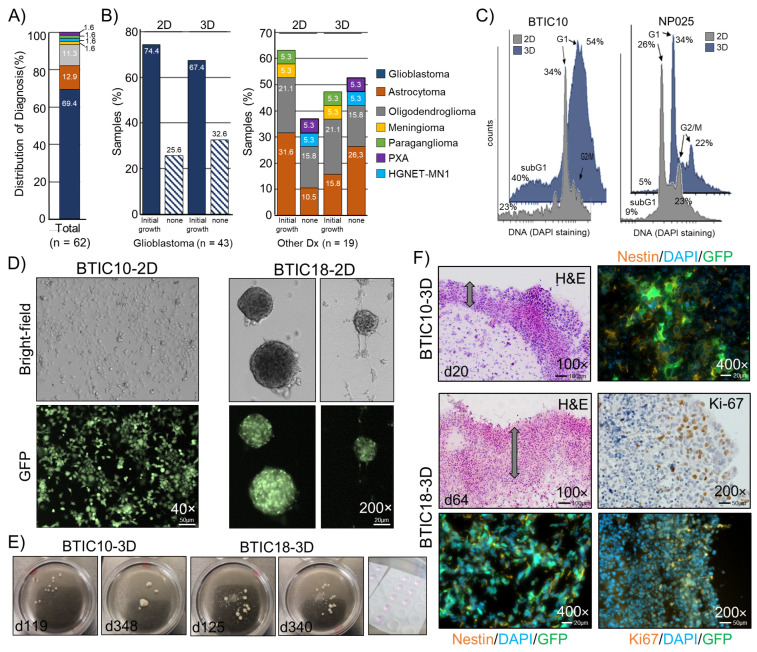
Figure 1.
Establishment and characterization of patient-derived 3D cell culture models. (A) Distribution of diagnoses within the sample cohort in percent. (B) Samples with and without signs of growth for 2D and 3D cultures. Percent was calculated according to the total number of samples, glioblastoma (n = 43, left panel), and all other diagnoses (n = 19, right panel). (C) Representative histograms of the cell cycle analysis of two patient-derived GBM cell lines cultured in 2D and 3D. Percent cells are indicated. (D) Representative images of adherent or in suspension growing 2D cultures (passages 18 to 20). (E) 3D cultures shown at ~4 and ~12 months. Right image: Matrigel™ drops with mixed cells. (F) Images of H&E stained cryosections (8 μm) and sections stained for the stemness marker Nestin and the proliferation marker Ki-67 from areas of the cell dense edge region are shown, and constitutive GFP fluorescence is indicated. Nuclei counterstained with DAPI. The cell-rich outer layer is indicated by an arrow. Magnifications and scale bars are indicated.

