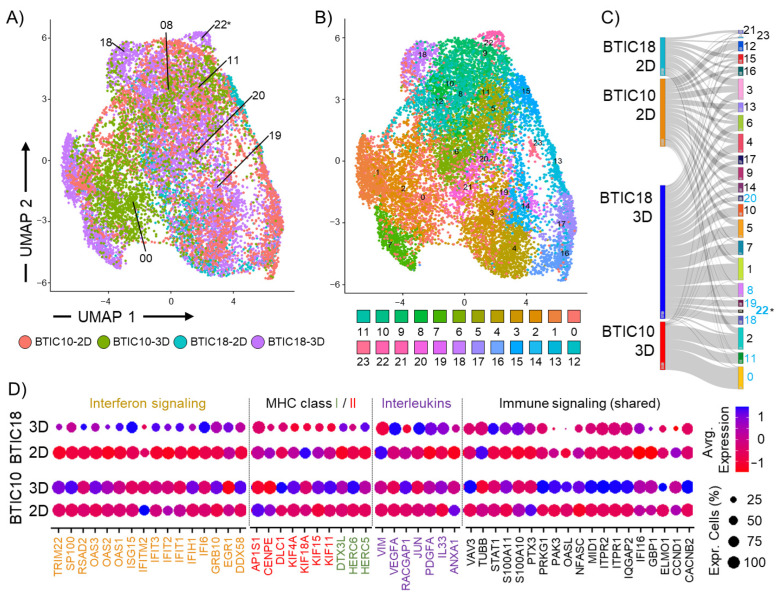
Figure 4.
Single-cell RNA sequencing analysis of two GBM models. Shown are 2-dimensional reduction UMAP plots of an integrated analysis for 2 GBM models (BTIC10 and BTIC18) cultured in 2D or 3D for (A) models and culture conditions and (B) cell heterogeneity (cell clusters). Cell clusters of interest are indicated. (C) Sankey plot shows the contribution of models and culture conditions to identified cell clusters. Unique 3D cluster 22 is indicated (*), and 3D dominated clusters are highlighted (blue). (D) Expression of selected genes associated with immune regulatory signaling pathways (Interferon, MHC class I/II, Interleukins) is shown for 2D and 3D cultures of BTIC10 and BTIC18. Level of expression is indicated by circle size representing the percent of cells and with a color code indicating average expression (red = decrease, blue = increase).

