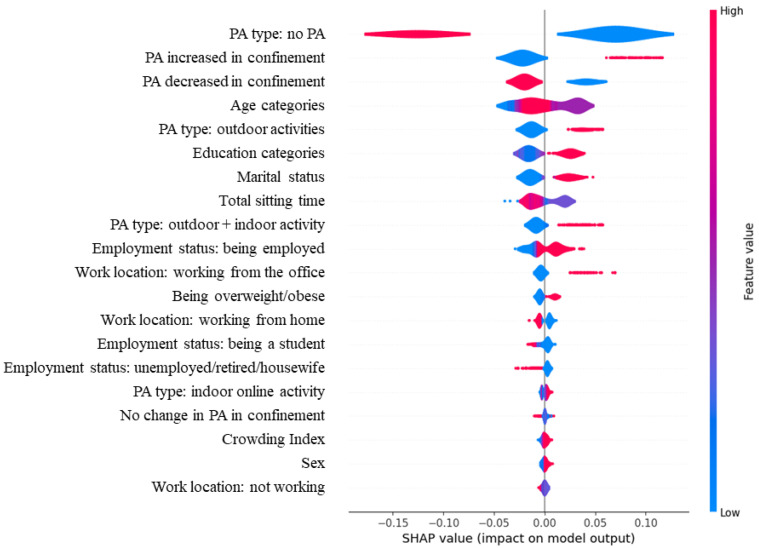
Figure 1.
This figure is a SHAP analysis representation of the best-performing Random Forest model, showing the influence of the features on the total model, and thus on the target variable, which is here total PA ≥ 600 MET·min/week. The SHAP value shows the positive or negative impact of each feature on the model output (here, predicting total PA ≥ 600 MET·min/week). The feature value uses colors to represent the value of each feature, with red being a higher value, and blue being a lower one.

