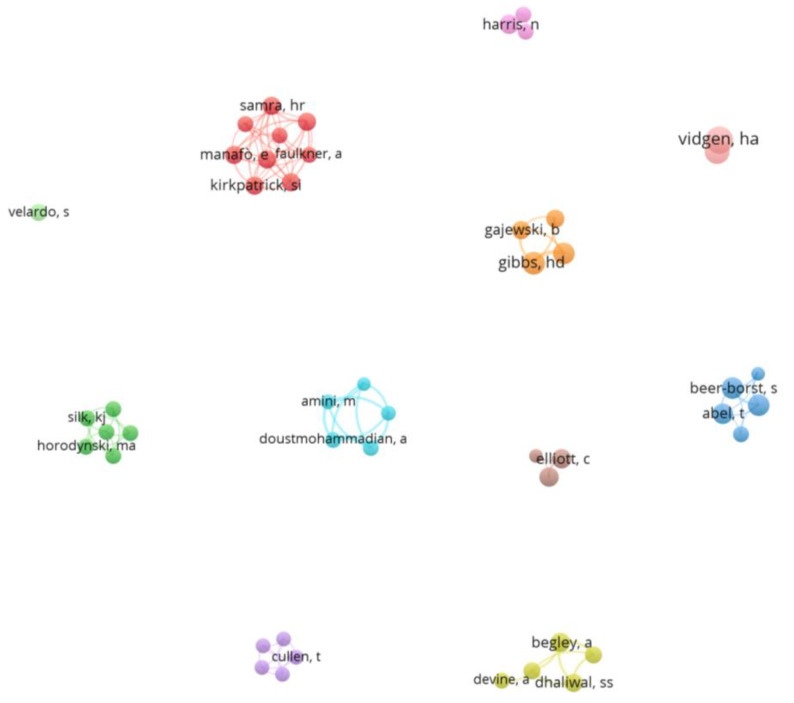
Figure 5.
Network visualization map of co-authorship research. The size of the circle is determined by the total number of citations received by all documents published by the author. The distance between two authors in the visualization approximately indicates the relatedness of the authors in terms of co-authorship links. In general, the closer two authors are located to each other, the stronger their relatedness. The strongest co-authorship links between authors are also represented by lines. The query used in the title, abstract, and keywords was: “Nutrition literacy” OR “food literacy” OR “nutritional literacy”.

