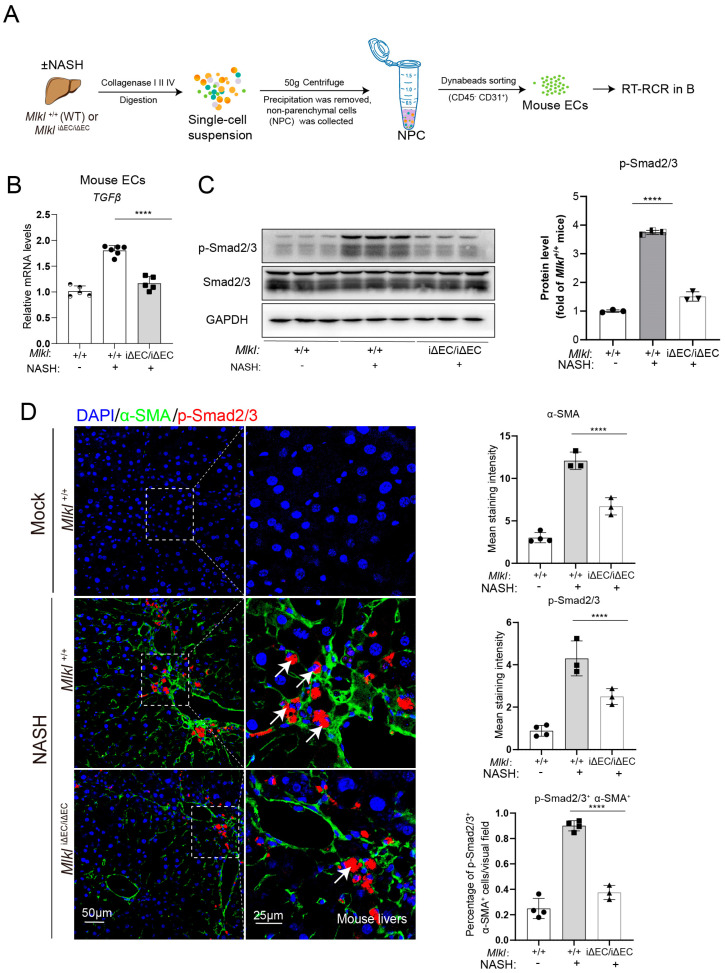
Figure 6.
EC-specific knockout of Mlkl reduces the pro-fibrotic TGFβ/Smad 2/3 signaling axis between endothelial cells and HSCs. (A) The experimental scheme for isolating primary endothelial cells (ECs) from livers of indicated mice. (B) RT-qPCR analyses of TGFβ in mouse ECs from Mlkl+/+ and MlkliΔEC/iΔEC NASH model. (C) Immunoblotting analyses of Smad2/3 and p-Smad2/3 expression in the mouse liver. (D) Representative immunostaining images shown that the expression of p-Smad2/3 (red) colocalized with activated HSCs marker, α-SMA (green) in liver from Mlkl+/+, and MlkliΔEC/iΔEC NASH model. Activated HSCs co-located with p-Smad2/3 (White arrows). DAPI staining was used to identify the nuclei. Summarized histogram shows the average area of α-SMA, p-Smad2/3, and co-localization of p-Smad2/3 with α-SMA per field. Left: ROI (region of interest), scale bars: 50 μm. Right: Magnified images of indicated dotted box areas, scale bars: 25 μm. n ≥ 3 per group. Data are shown as means ± SEMs. **** p < 0.0001.

