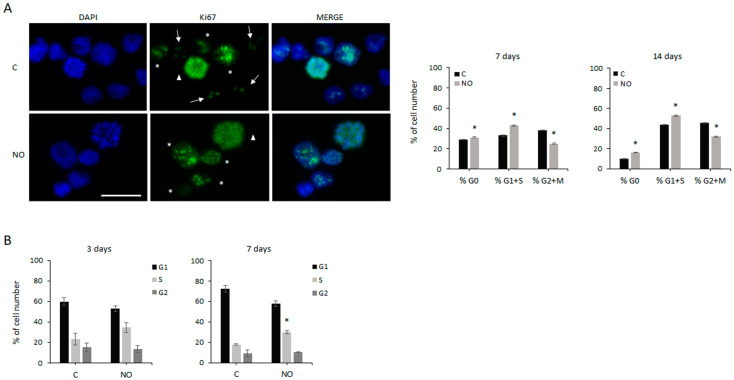
Figure 3.
NO induces GSCs’ S phase accumulation. (A) Representative immunofluorescence images showing GSCs untreated (C) and after 14 days of NO exposure (NO). The same analysis was also performed after 7 days of NO administration. Nuclei stained with DAPI, Ki67 expression, and merged images are shown. Ki67 staining patterns indicate different stages of the cell cycle: asterisks indicate cells in G1/S phases, arrows indicate cells in G2 phase, and triangles indicate cells in mitosis. The scale bar = 50 µm is the same in every image. The adjacent graphs show the changes induced after 7 and 14 days of NO treatment on the percentage of cells in different phases of the cell cycle and in G0 (Ki67− cells). The values were obtained from the analysis of at least 15 fields and 100–150 cells for each sample. All the values represent the mean ± SEM. * p < 0.05 vs. untreated control cells. (B) Flow cytometry analysis of the cell cycle progression after 3 and 7 days of NO exposure. Results represent the mean ± SEM from 3 experiments. * p < 0.05 vs. untreated control cells.

