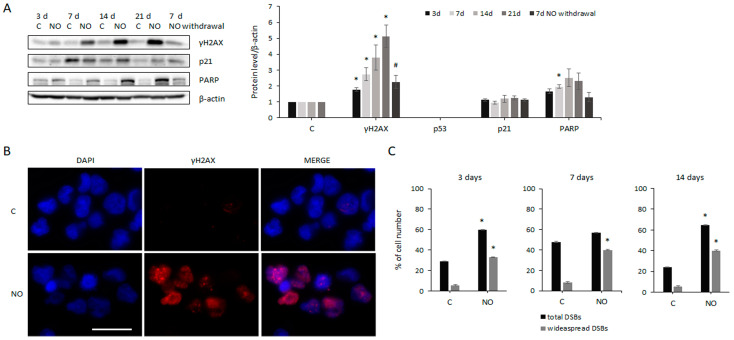
Figure 4.
Effects of NO on GSCs’ DNA integrity. (A) Representative Western blots showing the expression of several markers of the DNA damage response in untreated cells (C) as well as after 3, 7, 14, and 21 days of NO administration (NO) and after 14 days of NO exposure plus 7 days of treatment withdrawal (right lane). The level of each protein was normalized to β-actin. Line chart shows the fold increase in the level of each protein after NO treatment calculated with respect to untreated cells at each time point, to which a value equal to 1 was arbitrarily assigned. Values represent the mean ± SEM of the densitometric analysis of at least 3 experiments. * p < 0.05 vs. control cells; # p < 0.05 vs. 21 days NO-treated cells. (B) Representative immunofluorescence staining showing GSCs untreated (top) and after 14 days of NO treatment (bottom). Nuclei, γH2AX expression, and merged images are shown. The scale bar = 50 µm is the same in every image. The same analysis was also performed on cells treated with NO for 3 and 7 days. (C) Graphs show the percentage of all the cells containing DSBs and those containing only widespread DSBs in NO-treated and untreated cells. The mean ± SEM of the values obtained from the analysis of at least 15 fields and 100–150 cells for each sample is shown. * p < 0.05 vs. control cells.

