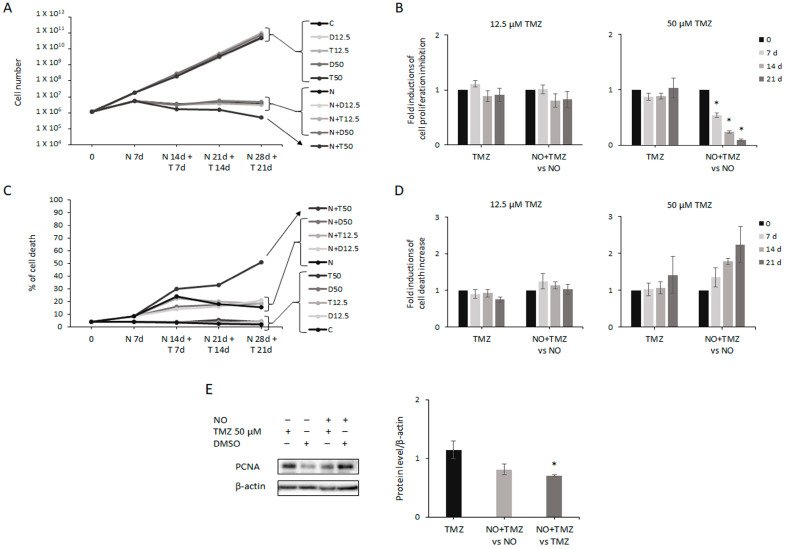
Figure 6.
NO plus Temozolomide (TMZ) cotreatment further reduces cell proliferation. (A) Representative experiment showing the proliferation of GSCs evaluated after 7 days of treatment with 100 µM NO alone (N) and followed by combined treatment with NO and two concentrations (12.5 and 50 µM) of TMZ (N + T), or DMSO (N + D) at the same dilutions, for 7, 14 and 21 days. TMZ (T) and DMSO (D) were also tested on untreated cells (C), as a control. (B) The graphs show the effect of TMZ alone, normalized to DMSO, and the effect of the combined treatment with respect to NO administration alone on GSC proliferation. The mean ± SEM of at least two experiments is represented. * p < 0.05 vs. NO-treated cells. (C) Representative experiment showing GSCs’ death following exposure to NO (N), TMZ (T), DMSO (D), and NO plus TMZ (N + T) or NO plus DMSO (N + D), as indicated, and following the same experimental plan as described in panel (A). (D) The graphs show GSCs’ death upon TMZ administration alone and upon combined treatment analyzed with respect to NO treatment alone. Each bar represents the effect of TMZ normalized to DMSO. (E) Representative Western blot showing the effect of 21 days of 50 µM TMZ and DMSO administration, alone and in the presence of NO, on PCNA expression. The graph shows the densitometric analysis of the bands where TMZ’s effect was evaluated with respect to DMSO (left bar), cotreatment-induced changes were analyzed with respect to NO single administration (middle bar) as well as further normalized to TMZ (right bar). The mean ± SEM of two experiments is shown. * p < 0.05 vs. TMZ-treated cells.

