Figure 7.
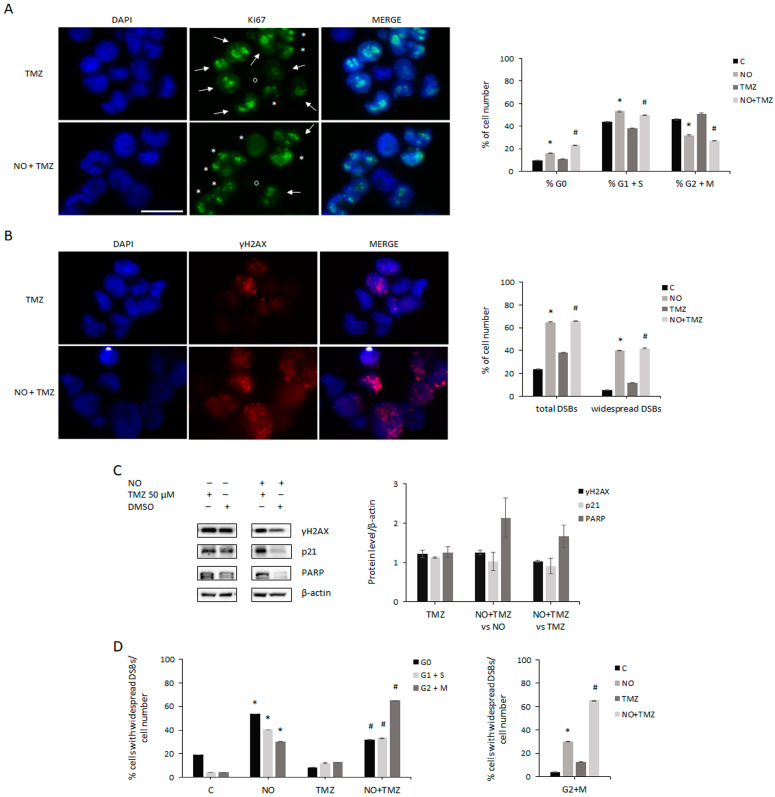
Effects of cotreatment on cell cycle progression and DNA damage. (A) Representative immunofluorescence of GSCs after 7 days of TMZ (top) and TMZ plus NO cotreatment (bottom) showing nuclei, Ki67 foci, and merged images. Ki67 staining patterns indicate different stages of the cell cycle: asterisks indicate cells in G1/S phases, arrows indicate cells in G2 phase, and circles indicate cells in G0 (Ki67− cells). The scale bar = 50 µm is the same in every image. The same analysis was also performed on GSCs untreated or treated with NO for 14 days (shown in Figure 3A). The graph shows the changes induced by the indicated treatments on the percentage of cells in different phases of the cell cycle and in G0, evaluated through the peculiar pattern of Ki67. The values were obtained from the analysis of at least 15 fields and 100–150 cells for each sample. All the values represent the mean ± SEM. * p < 0.05 vs. untreated cells; # p < 0.05 vs. TMZ-treated cells. (B) Representative immunofluorescence staining of GSCs after 7 days of TMZ (top) and TMZ plus NO cotreatment (bottom) showing nuclei, γH2AX foci, and merged images. The scale bar = 50 µm is the same as panel A. The same analysis was performed on GSCs untreated and after 14 days of NO treatment (shown in Figure 4B). The graph shows changes induced by the different treatments on the percentage of cells containing total DSBs (left bars) and cells containing only widely spread DSBs staining throughout the nuclei (right bars). The values were obtained from the analysis of at least 15 fields and 100–150 cells for each sample. All the values are represented as mean ± SEM. * p < 0.05 vs. untreated cells; # p < 0.05 vs. TMZ-treated cells. (C) Representative Western blots showing the expression of markers of the DNA damage response and repair after 21 days of exposure to 50 µM TMZ, or DMSO used at the same dilution, in the presence (right) or absence (left) of NO (TMZ and DMSO administration started 7 days after NO). The expression of each protein was normalized to β-actin. The graph shows the level of each protein after TMZ administration alone (left bars) and the changes induced by NO plus TMZ cotreatment with respect to NO (middle bars) and TMZ (right bars). The mean ± SEM of the densitometric analysis of 2 experiments is shown. (D) The left graph shows the percentage of cells with widespread DSBs in each phase of the cell cycle and in G0, identified through the peculiar pattern of Ki67, normalized to the percentage of cells in the same cell cycle phase. The values were obtained from the analysis of at least 15 fields and 100–150 cells for each sample. The values are represented as mean ± SEM. * p < 0.05 vs. untreated cells; # p < 0.05 vs. TMZ-treated cells. The right graph shows only the percentage of cells in G2 + M phase with widespread DSBs after the indicated treatments (highlighted from the left graph).

