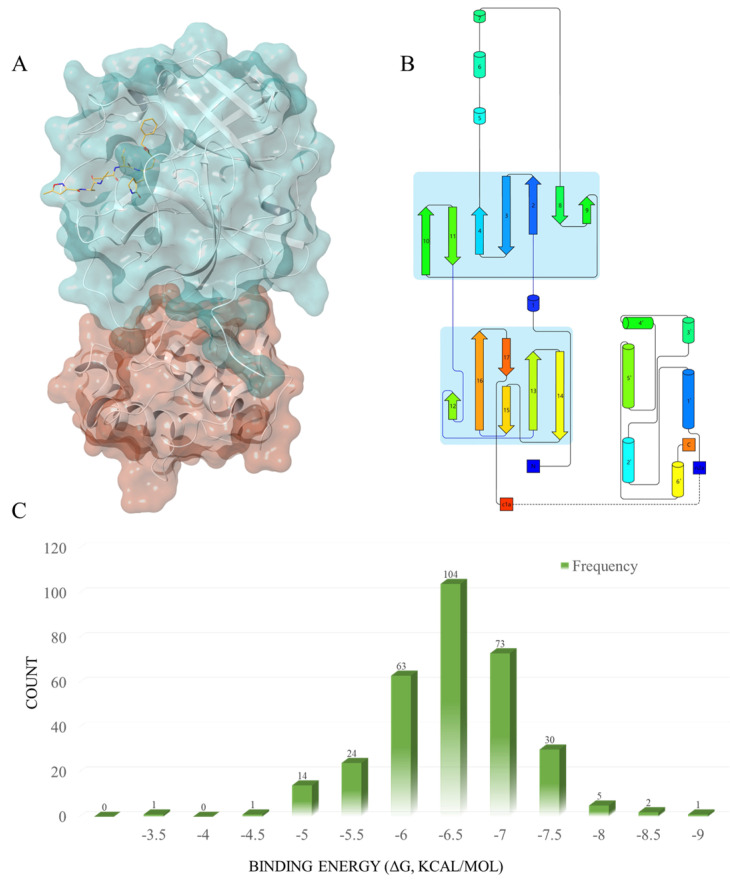
Figure 2.
(A) The three-dimensional spatial structure of the main protease; Domain 1 (blue) and Domain 2 (red), with the native ligand N3 (yellow). (B) The secondary structure of the main protease. This figure was produced using the Pro-origami website (http://munk.cis.unimelb.edu.au/pro-origami/porun.shtml, accessed on 30 June 2016). The barrels represent α-helices; the arrows represent β-sheets. (C) The frequency distribution of the compound docking scores, based on the SP docking results.

