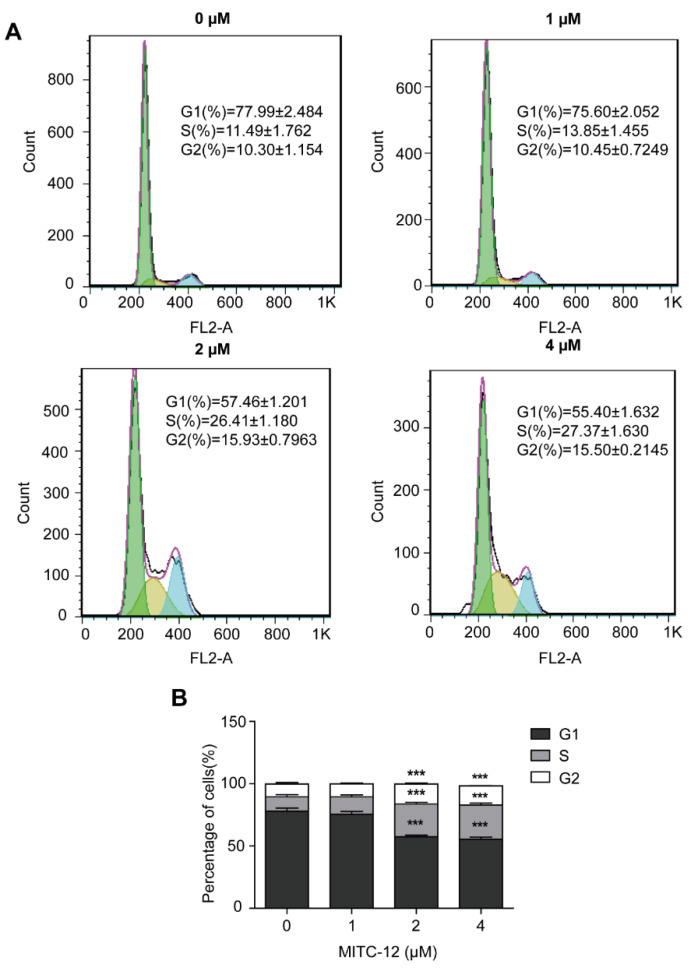
Figure 4.
MITC-12 induced cell cycle arrest in U251 cells. U251 cells were treated with MITC-12 (0, 1, 2, and 4 μM) for 24 h. (A) The cell cycle distribution of U251 cells was determined by flow cytometry. (B) Statistical analysis of three independent experiments. Data are expressed as mean ± SEM. Asterisk indicates significant difference compared to the control group; *** p < 0.001.

