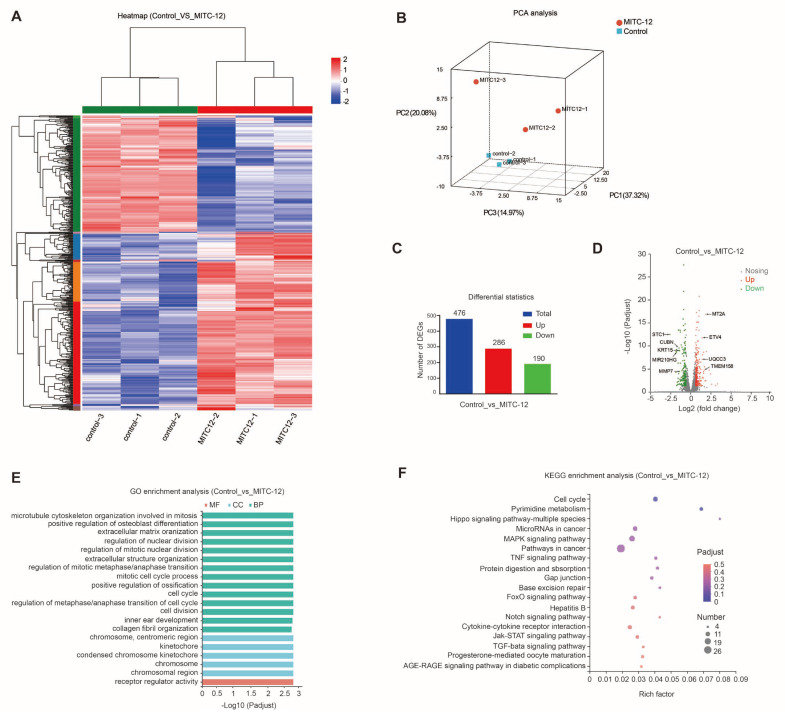
Figure 5.
Transcriptomic analysis of U251 cells. U251 cells were treated with MITC-12 (0 and 2 μM) for 24 h. (A) Heatmap of two groups of differentially expressed genes (DEGs). Colors indicate the normalized expression values of genes in each sample: red, higher expression; blue, lower expression. (B) Principal component analysis (PCA) between the two groups. (C) Comparison of numbers of DEGs. (D) Volcano plot showing DEGs. (E) GO enrichment analysis. Red, molecular function (MF); blue, cellular component (CC); green, biological process (BP). (F) KEGG enrichment analysis of DEGs between the control and MITC-12 groups. The top 20 enrichment results are displayed by default with Padjust < 0.05.

