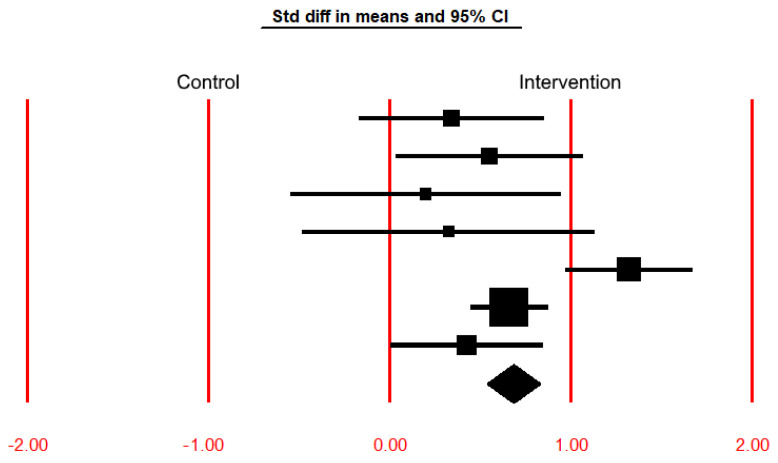
Figure 2.
Graphical representation (forest plot) of the treatment effect sizes (the effect size index is the standardized difference in means) and 95% confidence intervals of each study for the results shown in Table 2. The diamond represents the point estimate of the averaged studies.

