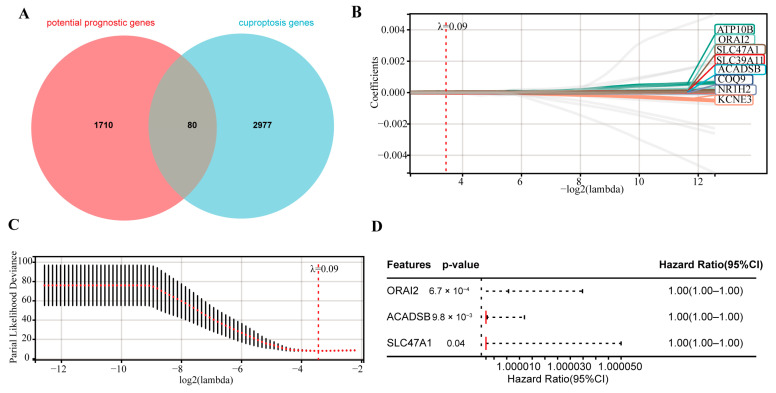
Figure 2.
Construction of the CRTG signature using LASSO and multivariate Cox regression. (A) Venn diagram indicating 80 prognostic CRGs. (B) Distribution of the LASSO coefficients of the 8 prognostic CRGs in the training cohort. (C) The generated coefficient distribution plots for the logarithmic (lambda) sequence for the selection of the best parameter (lambda). (D) Forest plot of the three CRGs screened via multivariate Cox regression.

