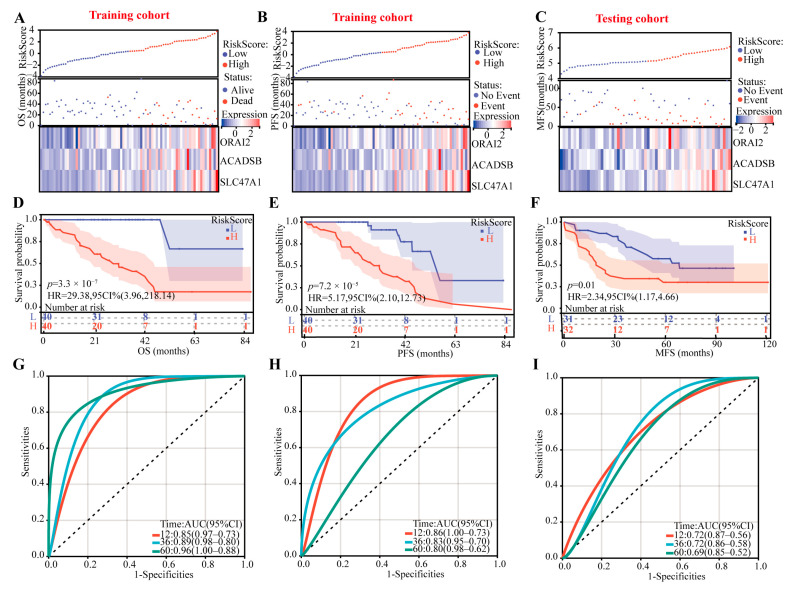
Figure 3.
Identifying the prognostic ability of the CRTG signature in both the training and testing cohorts. (A–C) The distributions of the risk scores and patients’ survival times and the expression heatmaps of ORAI2, ACADSB, and SLC47A1. (D–F) Kaplan–Meier curves of the CRTG signature risk score. (G–I) ROC curves of the CRTG signature.

